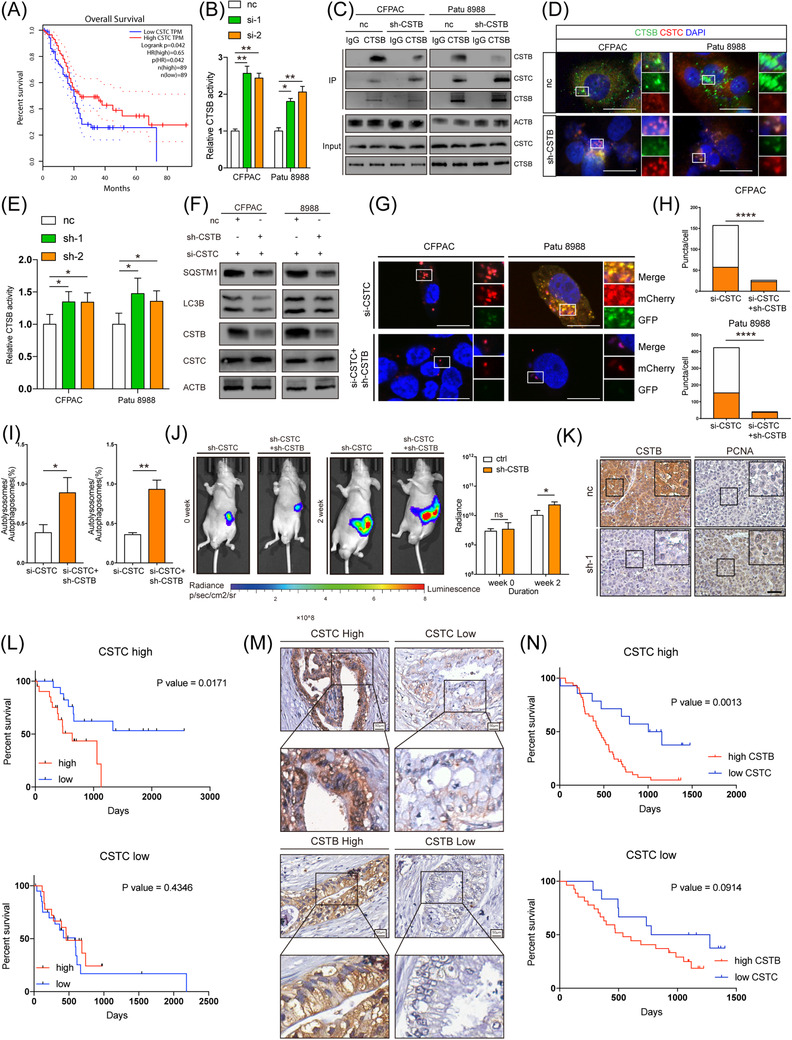
FIGURE 5.

CSTB interacts with Cathepsin B (CTSB) to prevent it from binding to CSTC. (A) Kaplan–Meier curves show that patients with high CSTC were accompanied with better overall survival (OS). (B) Relative CTSB activity of control and si‐CTSB CFPAC and Patu 8988 cells. (C) Immunoblots of CSTB, CSTC and CTSB in immunoprecipitate of CTSB in control and sh‐CSTB‐1 CFPAC and Patu 8988 cells. (D) IF staining for CTSB (green) and CSTC (red) in control and sh‐CSTB‐1 CFPAC and Patu 8988 cells. (E) Relative CTSB activity of control and sh‐CSTB CFPAC and Patu 8988 cell with prior CTSB silencing. (F) Immunoblots of SQSTM1, LC3B, CSTB, and CSTC in control and sh‐CSTB‐1 CFPAC and Patu 8988 cells transfected with si‐CSTC. (G) Representative images of control and sh‐CSTB‐1 CFPAC and Patu 8988 cells with prior CTSB silencing expressing mCherry‐GFP–LC3B. (H,I) Quantification of LC3B puncta representing autophagosomes (yellow) and autolysosomes (red) in cells. (J) Representative bioluminescence photograph of mice orthotopically implanted with luciferase‐expressing and CSTC‐silencing Patu 8988 cells with or without sh‐CSTB‐1. (K) Representative IHC images of CSTB and PCNA from orthotopic pancreatic ductal adenocarcinoma (PDAC) xenografts samples. (L) Kaplan–Meier analysis of CSTB in patients with high CSTC expression (upper, 45) and patients with low CSTC expression (lower, 45) in TCGA database. (M) Representative images of CSTC and CSTB in Ruijin TMA spotted with human PDAC tissue cores. (N) Kaplan–Meier analysis of CSTB in patients with high CSTC expression (upper, 59) and patients with low CSTC expression (lower, 40) in the Ruijn cohort. Scale bar: 25 μm. *p < .05, **p < .01, ***p < .001, and ****p < .0001
