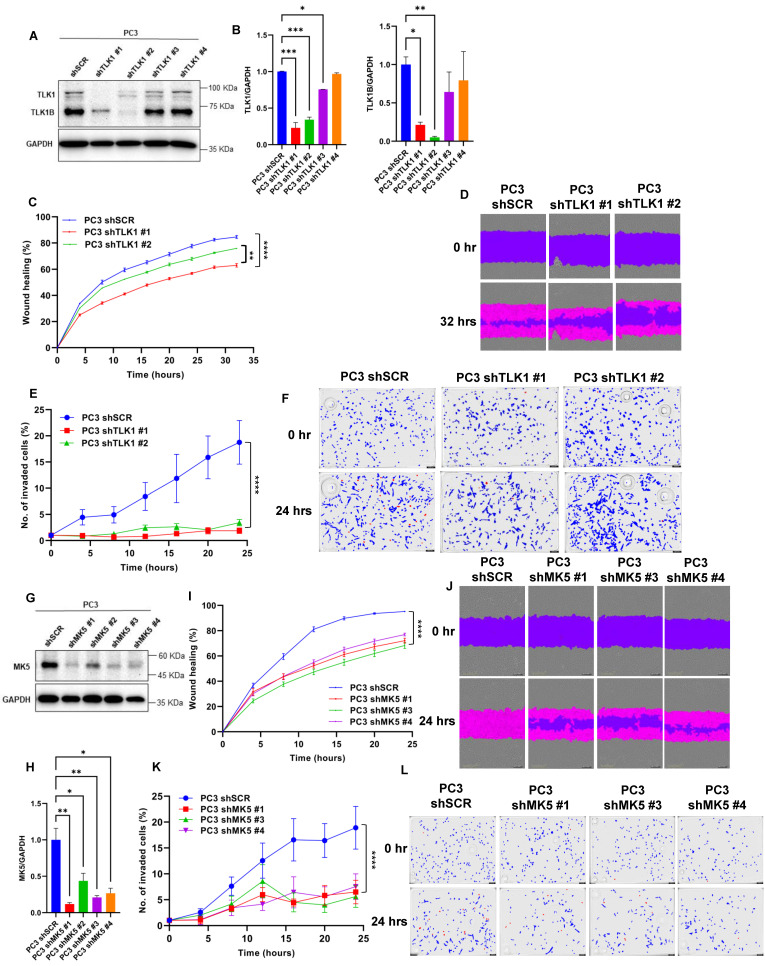
Figure 1.
Genetic depletion of TLK1 or MK5 leads to reduced motility and invasion of PC3 cells. (A) Stable knocked down of TLK1 and TLK1B upon either scrambled (shSCR) or four different TLK1-specific shRNA treatments in PC3 cells transduced with lentivirus. Image is the representation of two independent experiments (n = 2). (B) Quantification of TLK1 (left panel) and TLK1B (right panel) level upon TLK1 knockdown normalized to GAPDH in PC3 cells. (C,I) Scratch wound repair assay was conducted to determine the migration rate among (C) PC3 shSCR, PC3 shTLK1 #1, and PC3 shTLK1 #2; and (I) PC3 shSCR, PC3 shMK5 #1, PC3 shMK5 #3, and PC3 shMK5 #4 cells by plotting relative wound density against different time points; n = 6–12 biological replicates were used for each cell line. (D,J) Image representation of the scratch wound repair assay. (E,K) Trans-well invasion assay was conducted to determine cellular invasion capabilities among (E) PC3 shSCR, PC3 shTLK1 #1, and PC3 shTLK1 #2; and (K) PC3 shSCR, PC3 shMK5 #1, PC3 shMK5 #3, and PC3 shMK5 #4 cells at different time points, using Matrigel coating. The invasion rate was determined by plotting the total object phase area against time; n = 5–7 biological replicates were used for each cell line. (F,L) Image representation of the trans-well invasion assay. Blue color represents the cells in the top chamber, and red color represents the cells that invaded into the bottom chamber. (G) Stable knocked down of MK5 upon either scrambled (shSCR) or four different MK5-specific shRNA treatments in PC3 cells transduced with lentivirus. Image is the representation of two independent experiments (n = 2). (H) Quantification of MK5 level upon MK5 knockdown normalized to GAPDH in PC3 cells. One-way ANOVA, followed by Tukey’s post hoc analysis, was used for multiple group comparison. Groups that are significantly different from each other are indicated by asterisks: * = p < 0.05, ** = p < 0.005, *** = p < 0.0005, and **** = p < 0.0001. Error bar represents standard error of the mean (SEM). The whole blots of Figure 1 could be found in Figure S2.

