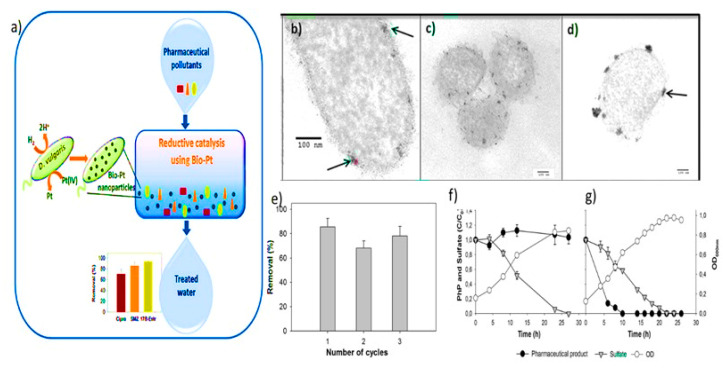
Figure 8.
(a) This represents complete work flow removal of pharmaceutical compounds (b–d) TEM images of cell-supported palladium nanoparticles. (e) Removal of sulfamethoxazole by the Bio-Pt catalyst in three consecutive assays. Removal data obtained after 24 h of reaction. The error bars indicate the standard deviations of three independent experiments. The error bars indicate the standard deviations of three independent experiments. (f,g) Profiles of growth and removal of four pharmaceutical compounds (PhP) for 17β-estradiol and ibuprofen. The error bars indicate the standard deviations of three independent cultures [39]. Reprinted/adapted with permission from Ref. [39]. 2022, Elsevier B.V.

