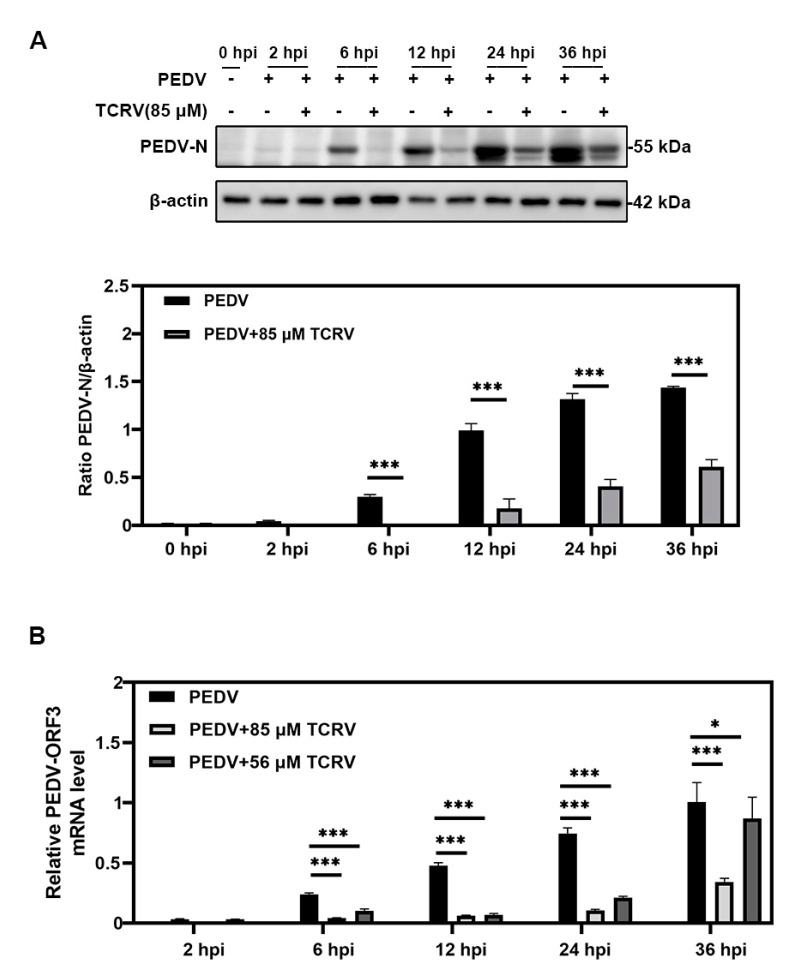
Figure 2.
Inhibitory effect of TCRV on PEDV infection at different time points. (A) PEDV-infected cells treated with TCRV at different concentrations at 2, 6, 12, 24, and 36 hpi were analyzed by Western blotting. The PEDV N protein band was quantified as the ratio of the band intensities of PEDV N protein to β-actin in Western blotting. (B) PEDV-infected cells treated with TCRV at different concentrations at 2, 6, 12, 24, and 36 hpi were analyzed by RT-qPCR. Data from three independent experiments and error bars are presented as the mean ± SEM. * p < 0.05, *** p < 0.001.

