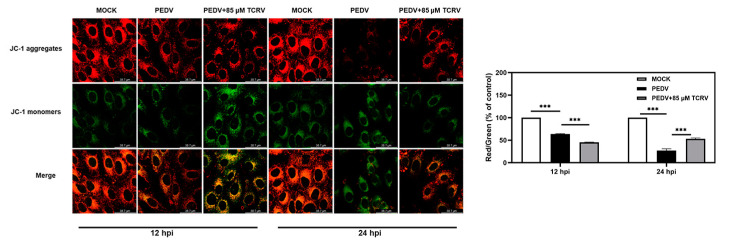
Figure 5.
Effects of TCRV on mitochondrial membrane potential. (A) The mitochondrial membrane potential of PEDV-infected Vero cells treated with the indicated concentrations of TCRV at 12 hpi and 24 hpi. The fluorescence signals were visualized using confocal immunofluorescence microscopy. Results were presented as the ratio of JC-1 aggregate (red) to JC-1 monomer (green). Data from three independent experiments and error bars are presented as the mean ± SEM. *** p < 0.001.

