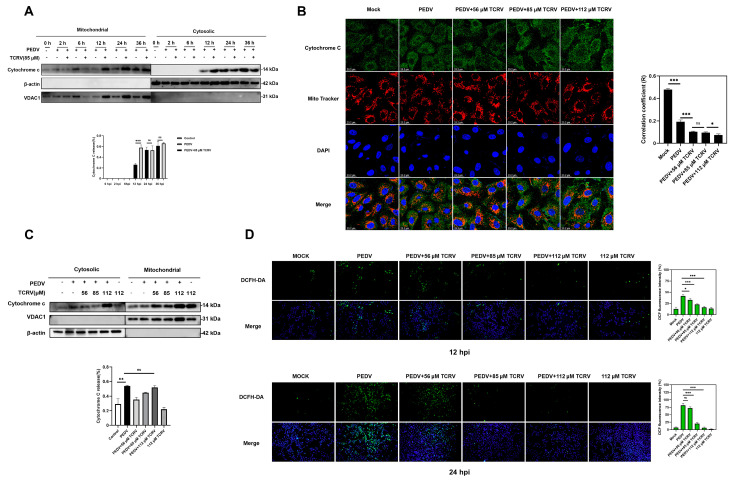
Figure 6.
TCRV promotes the release of cytochrome C from the mitochondria. (A) To analyze the subcellular localization of cytochrome C, PEDV-infected cells treated with TCRV at different concentrations at 2, 6, 12, 24, and 36 hpi were fractionated and mitochondrial and cytosolic fractions were subjected to Western blotting. VDAC1 was used as mitochondrial marker and β-actin was used as cytosolic marker (B) The treatment of PEDV-infected cells with TCRV at concentrations of 56 µM, 85 µM, and 112 µM for 24 h. Images were acquired by confocal laser-scanning microscopy, detecting cytochrome C (green), mitochondria (red), and nuclei (blue), which were visualized by DAPI (scale bar, 23.2 µm). Images were collected on a Leica SP8 Laser Scanning confocal microscope. Pearson’s correlation coefficient analysis was carried out using Image J software. (C) The treatment of PEDV-infected cells with TCRV at concentrations of 56 µM, 85 µM, and 112 µM for 24 h were fractionated and mitochondrial and cytosolic fractions were subjected to Western blotting. VDAC1 was used as a mitochondrial marker and β-actin was used as a cytosolic marker. (D) Intracellular ROS levels were detected by DCF fluorescence intensity. The graph presents the production of ROS in the PEDV-infected cells treated by TCRV. Data from three independent experiments and error bars are presented as the mean ± SEM. * p < 0.05, ** p < 0.01, *** p < 0.001, ns, not significant.

