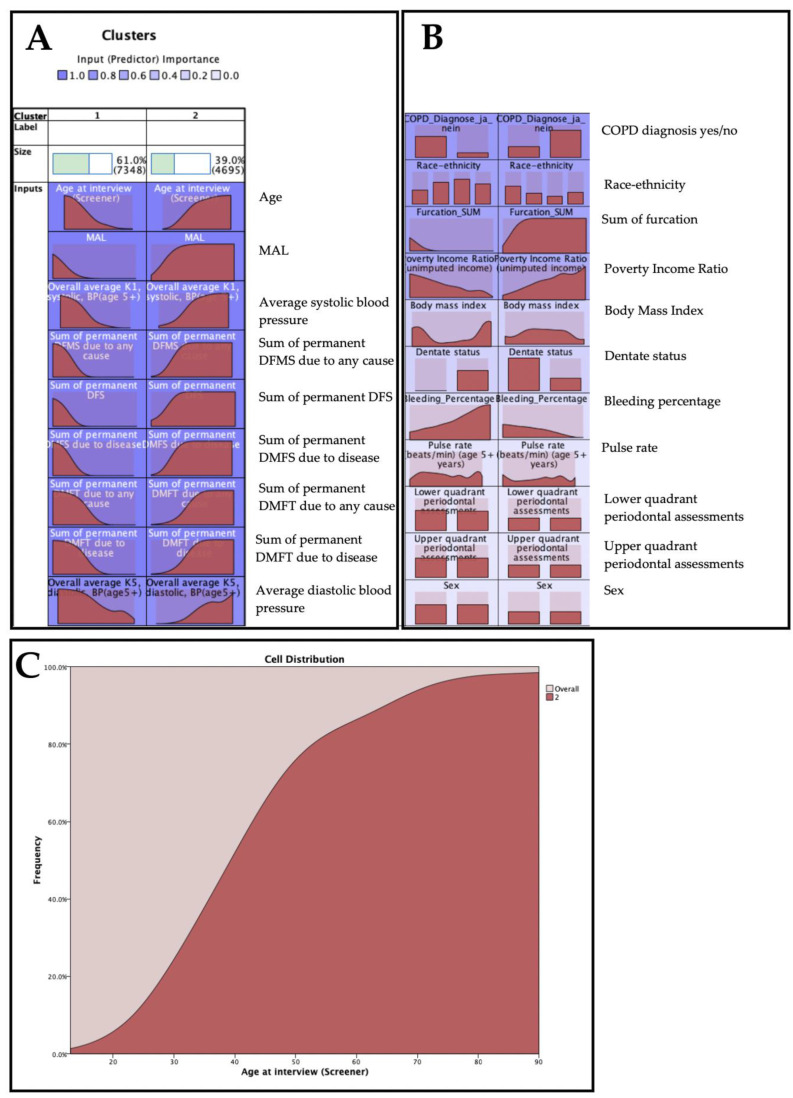
Figure 3.
K-means cluster analysis, including the COPD class variable. The most important feature to classify the data was the age at interview, followed by the mean attachment loss (MAL), the sum of permanent DMFS due to disease (i.e., caries or periodontitis), and the sum of permanent DMFT due to disease. In the distribution charts, the distribution of the features is shown for both clusters. (A) illustration of most important predictors (feature importance ≥0.8; (B) illustration of less important predictors (feature importance <0.8); (C) In order to facilitate interpretation, an example feature is presented (age at interview). According to the selected feature, the age distribution is shifted to the right for the high-risk cluster while it is shifted to the left for the low-risk cluster.

