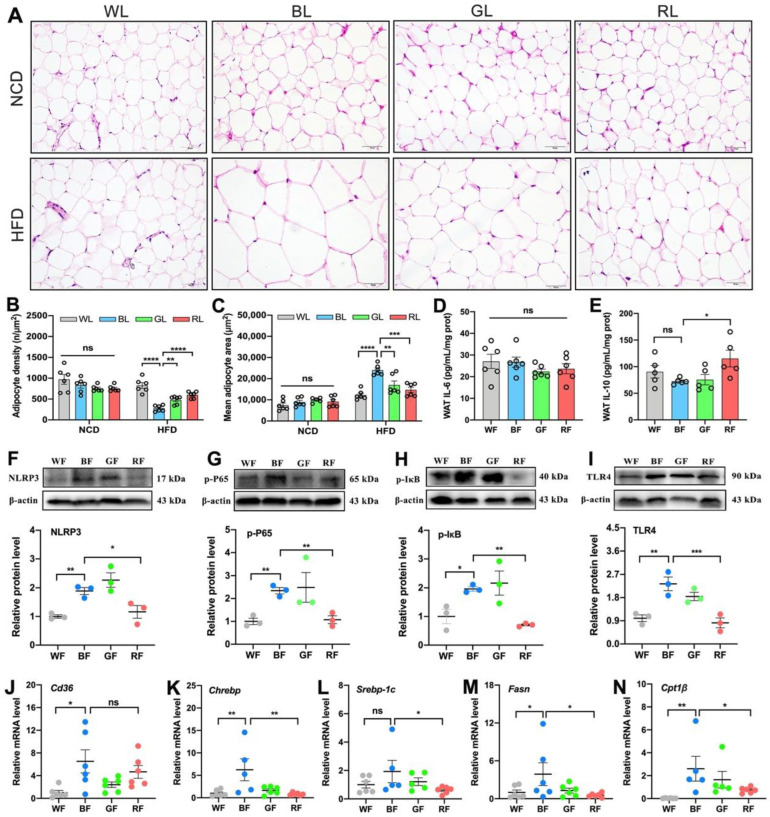
Figure 2.
Influences of monochromatic light exposure on WAT hypertrophy and inflammation in mice. (A) H&E staining of the Epi-WAT (scale: 50 μm). (B) Adipocyte density (n = 6). (C) Mean adipocyte size (n = 6). (D,E) Concentrations of IL-6 and IL-10 in the Epi-WAT (n = 6). (F–I) Relative protein expression levels of NLRP3, p-P65, p-IκB, and TLR4 in the Epi-WAT (n = 3). (J–N) Relative mRNA expression levels of Cd36, Chrebp, Srebp-1c, Fasn, and Cpt1β (n = 6). The circles represent the number of samples. The results are presented as the means ± SEM. * p < 0.05, ** p < 0.01, *** p < 0.001, **** p < 0.0001.

