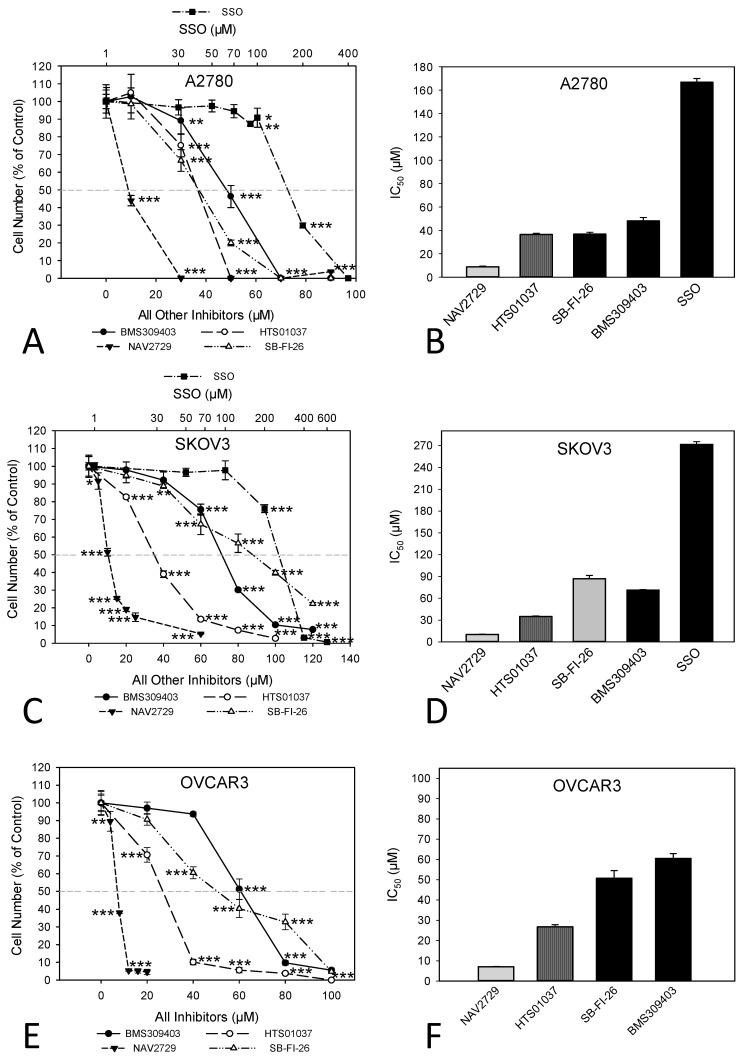
Figure 1.
Inhibitors of lipid handling proteins block the growth of OC cells in a dose-dependent manner. Exposure of A2780 (A,B), SKOV3 (C,D), or OVCAR3 (E,F) cells for 72 h to increasing concentrations of small molecule inhibitors of FABPs (BMS309403, HTS01037, SB-FI-26), FATP2, and ARF6 (NAV2729), as well as of FAT/CD36 (SSO), leads to a drug-specific reduction of cell numbers (A,C,E). Note that the concentrations of SSO are plotted on a logarithmic scale at the top of the graphs (A,C), while the concentrations of all other inhibitors are plotted on a linear scale at the bottom. The IC50 values for drug-mediated growth inhibition (B,D,F) vary over a wide dose range with NAV2729 being the strongest inhibitor, followed by HTS01037, BMS309403, and SB-FI-26, and SSO representing a rather inefficient growth inhibitor. Formazan dye assay was used. Means ± SD of three separate experiments with replicates. ANOVA followed by Scheffe test, p < 0.05 (*), p < 0.01 (**), and p < 0.001 (***) relative to solvent-treated cells (0 µM).

