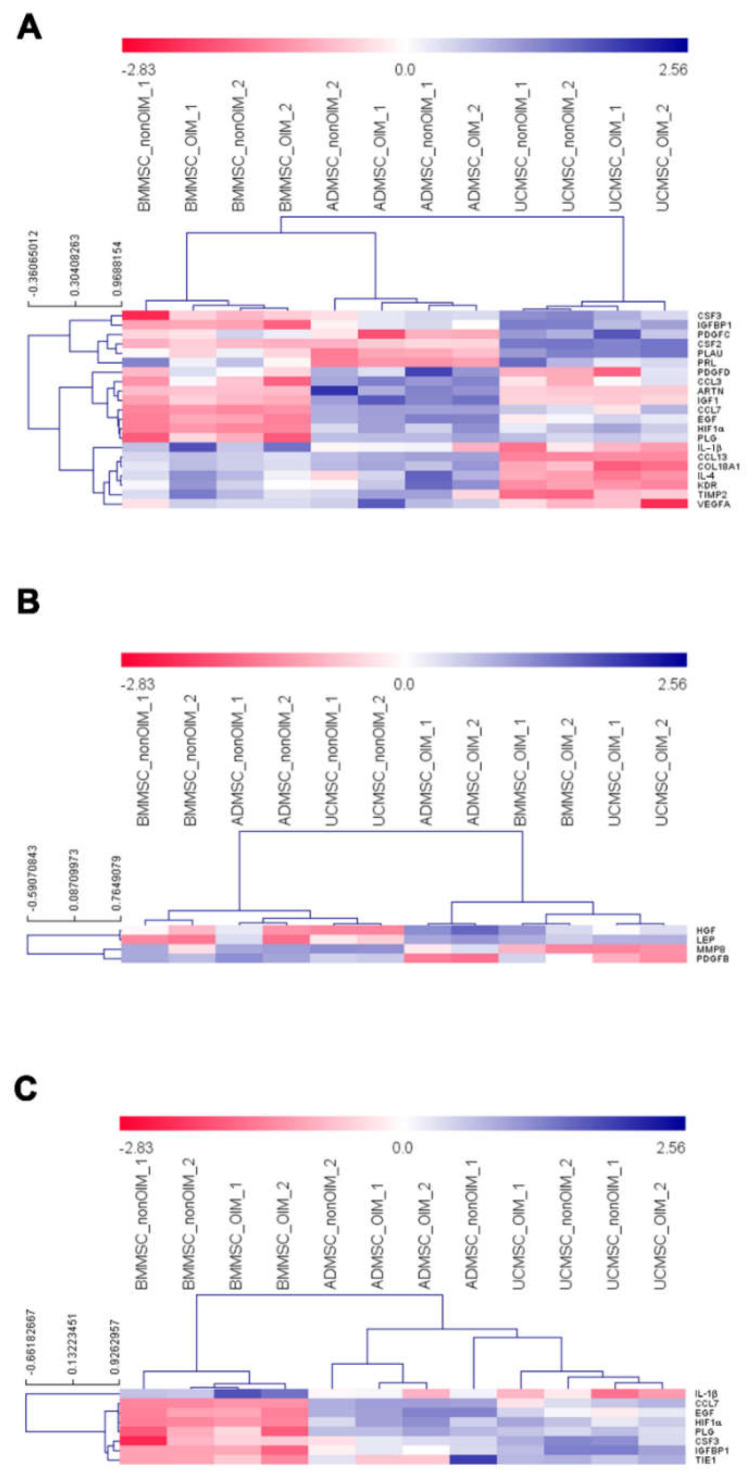
Figure 5.
Differentially expressed gene analyses. (A) A one-way ANOVA analysis showed the differentially expressed genes among MSCs from different sources. Permutations (1000), Pearson correlation, HCL clustering with average linkage, and p-value < 0.01 were used. (B) A t-test examined the differentially expressed genes between nonOIM and OIM samples. A p-value < 0.01 was used. (C) A t-test explored the differentially expressed genes between BMMSCs and the other two MSCs. A p-value < 0.01 was used. Red and blue colors represent high and low gene expression levels, respectively.

