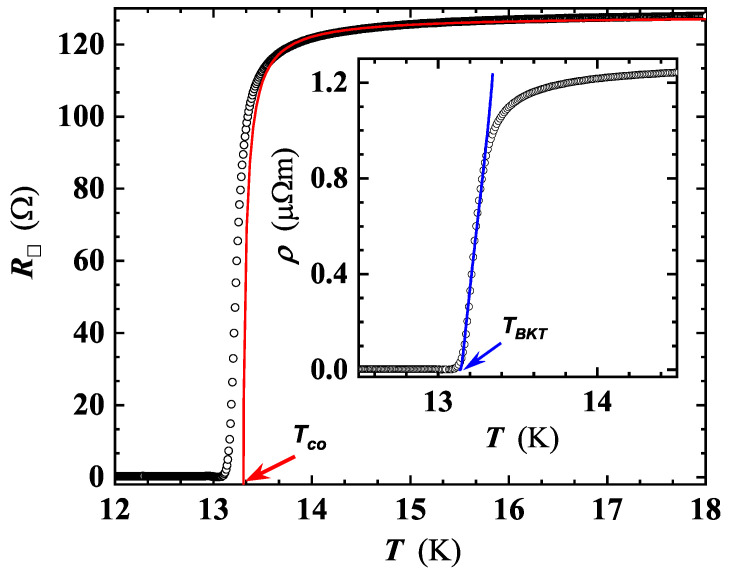
Figure 6.
Temperature-dependent sheet resistance around the superconducting transition temperature for MO10 (see Table 2). The red line is the least-squares fit by using Equation (1). The value of K (red arrow) is the intercept of the red line with the x-axis. Inset: least-squares fitting of the curve of MO10 by Equation (2). The intercept with the x-axis gives the value of (13.06 K, blue arrow).

