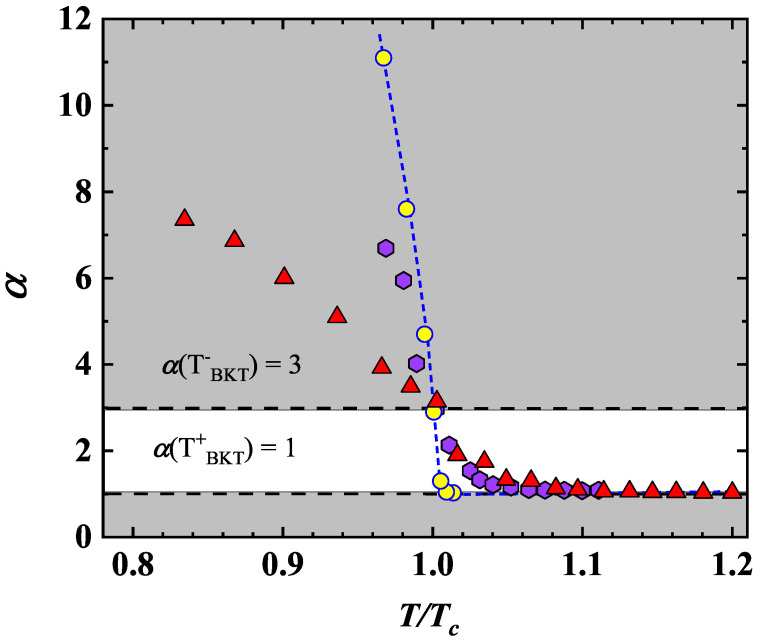
Figure 8.
Temperature−dependence of for MO10 (yellow circle), derived from the power-law fitting of the V-I curves plotted in the Figure 7. A jump in the value of from ≃1 to ≃3 (white region) was detected at , corresponding to . For comparison, the values for a 3 nm thick NbN film from the work of Venditti et al. (purple hexagon) [16] and for Mo from the work of Saito et al. (red triangle) [50] were added to the data. The broken line is a guide for the eyes. The temperature was normalized to for our and Saito et al. data. Venditti et al.’s values were derived by digitization of Figure (2e) in ref. [16].

