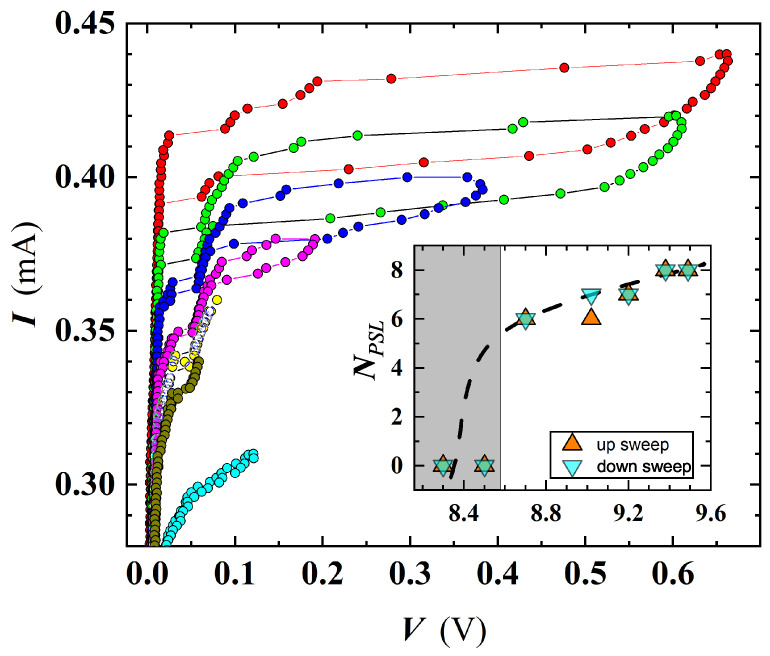
Figure 13.
I-V characteristics of MO5b, showing the occurrence of steps in the curves close to , progressively disappearing approaching . The T values for the shown curves are: 8.70 K (red), 9.02 (green), 9.20 K (blue), 9.38 K (magenta), 9.49 K (yellow), 9.60 K (olive), 9.98 K (cyan). Inset: number of TAPS extracted from I-V curves. The gray rectangle defines the T range where no PSL were detected.

