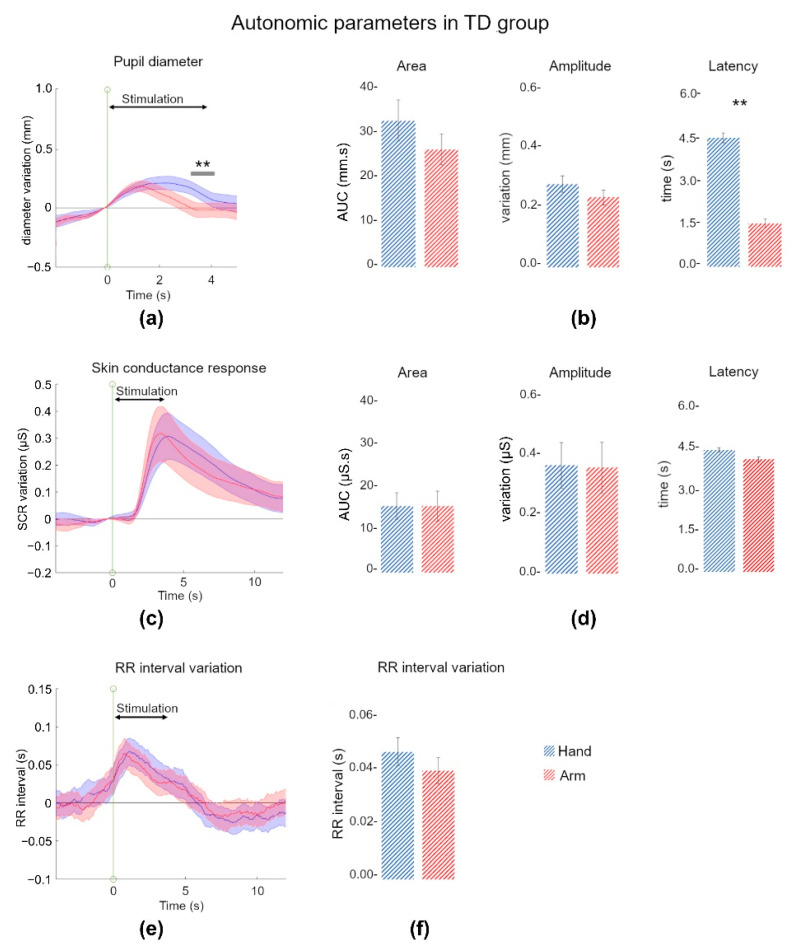
Figure 2.
ANS responses to tactile stimulation in the total TD group. (a) Mean pupil dilation (relative to the baseline value, in mm) as a function of time during an arm stimulation (red) or a hand stimulation (blue). The shading around the curve corresponds to the SEM. The green vertical line (0 s) indicates the beginning of the stimulation. The continuous black line indicates the length of the stimulation. The continuous grey line indicates the significant difference between the two curves. (b) Mean values (±standard error) for the three pupil parameters extracted for the two stimulation conditions (arm in red, hand in blue): AUC (in mm.s), maximum amplitude (in mm), and latency of the maximum response (in s). (c) Mean SCR (relative to the baseline value, in µS) as a function of time during an arm stimulation (red) or a hand stimulation (blue). Same conventions as in (a). (d) Mean values (±standard error) for the three skin conductance parameters calculated for the two conditions (arm in red, hand in blue): AUC (in µS.s), maximum amplitude (in µS), and latency of the maximum response (in s). (e) Mean RR interval (relative to the baseline value, in s) as a function of time during an arm stimulation (red) or a hand stimulation (blue). Same conventions as in (a). (f) Mean value (±standard error) of the RR interval (in s) calculated for the two conditions (arm in red, hand in blue). **: p < 0.001.

