
Figure 2. Plot of rounded Bonferroni-corrected p-values of the association between the 6 significant PCs and CSF and imaging biomarkers.
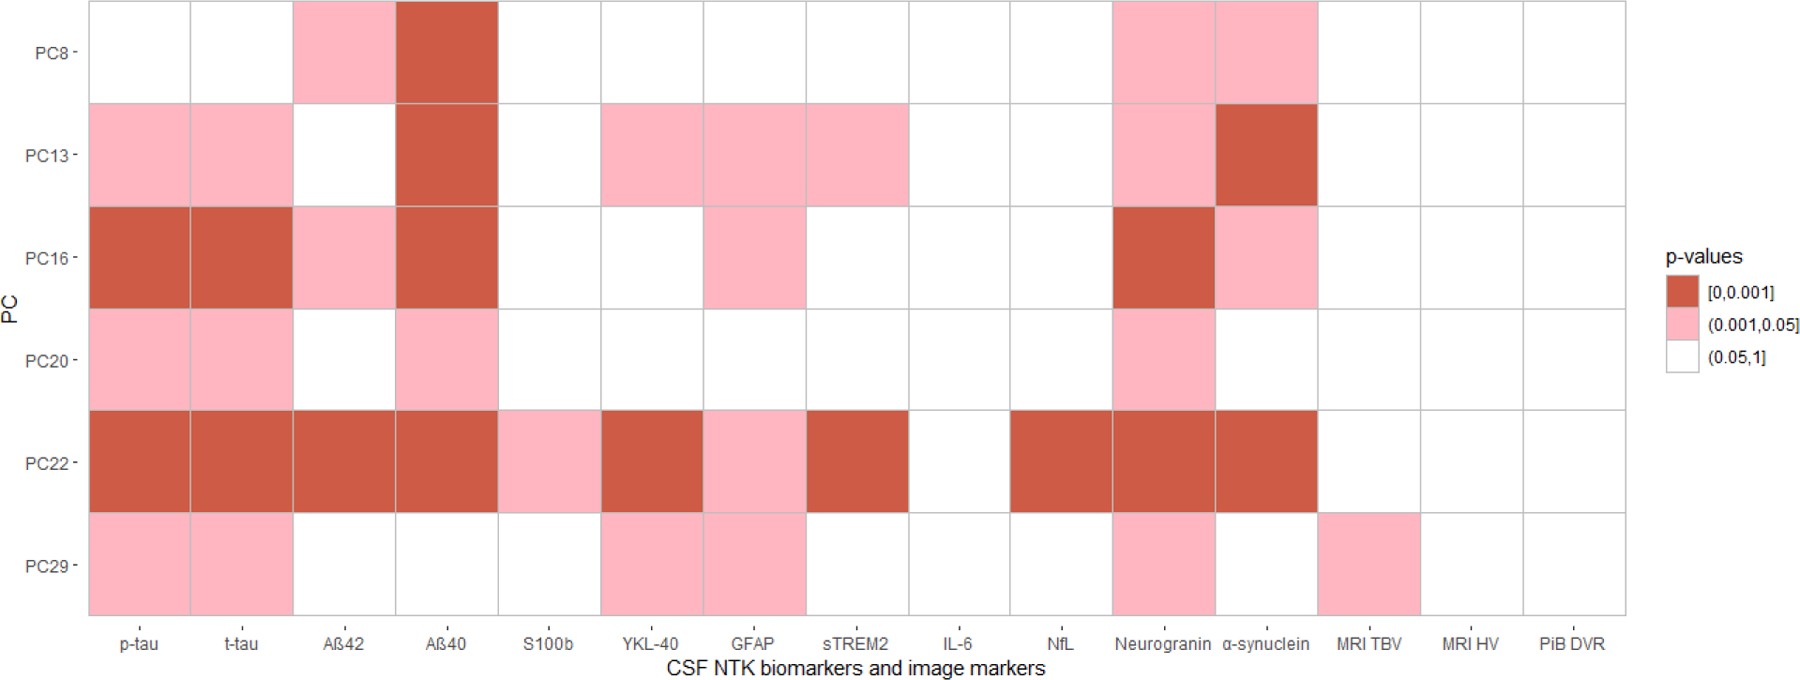
The colors of the cells indicate the p-value magnitudes.
Official websites use .gov
A
.gov website belongs to an official
government organization in the United States.
Secure .gov websites use HTTPS
A lock (
) or https:// means you've safely
connected to the .gov website. Share sensitive
information only on official, secure websites.
The colors of the cells indicate the p-value magnitudes.