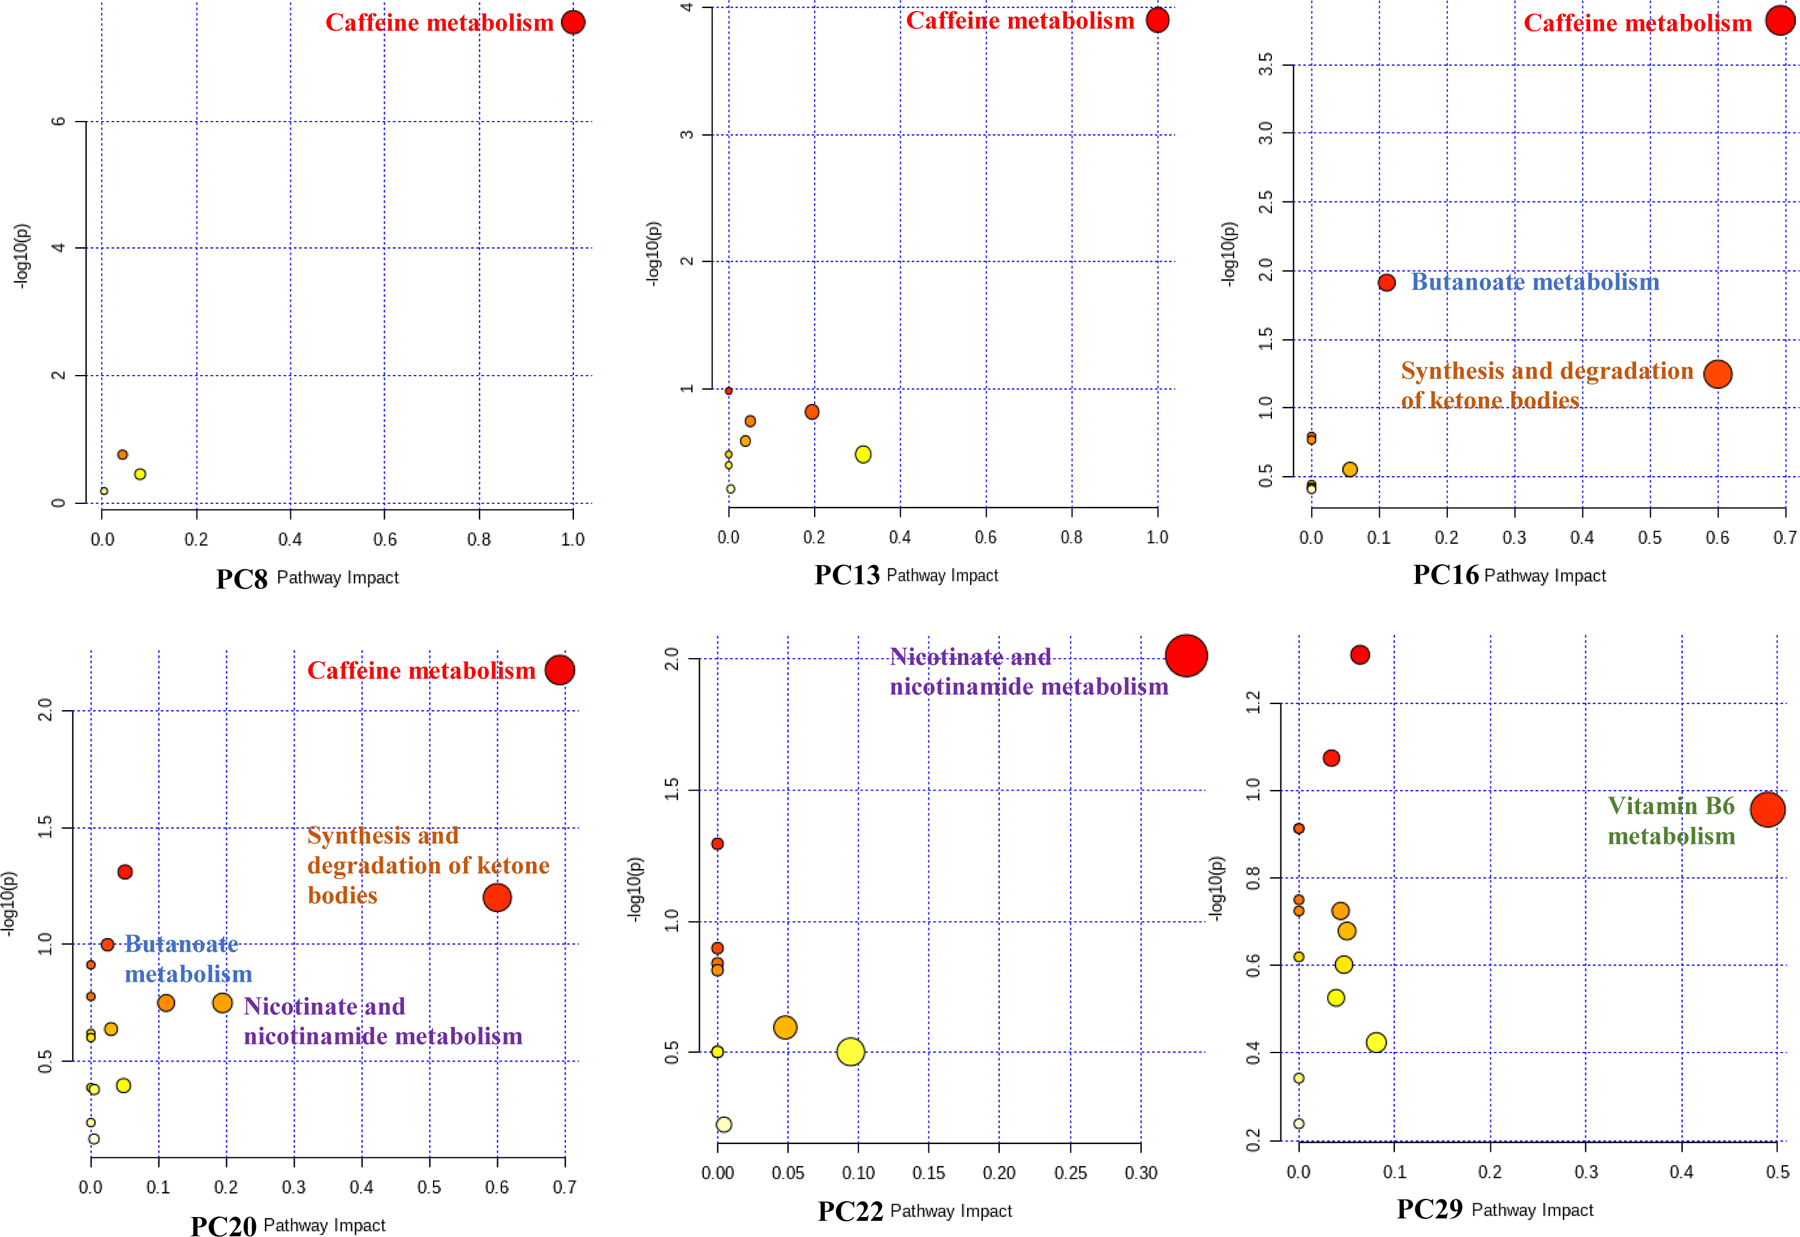
Figure 3. Pathway analysis results for all significant PCs.

The x-axis represents the pathway impact and the y-axis represents the pathway enrichment. Larger sizes and darker colors represent higher pathway impact and enrichment, respectively. The text of the pathway name is color coded such that each pathway has a unique color across the figures to easily see which pathways are enriched in multiple PCs.
