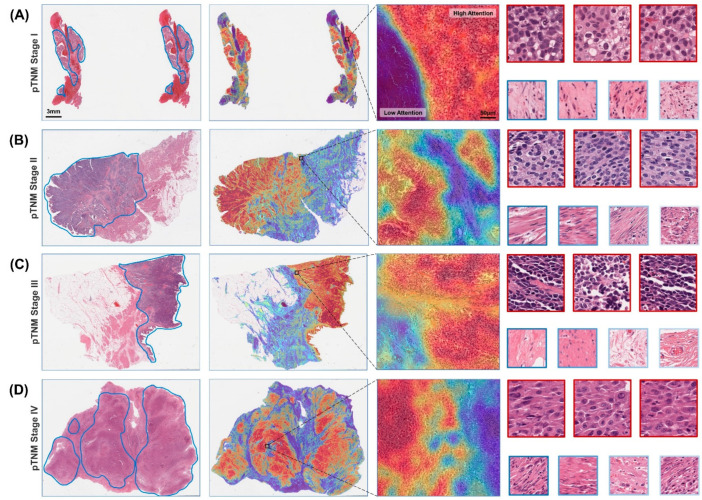
Figure 4.
Heatmaps of the diagnostic model on WSIs at different pathological stages. A representative WSI for each pathological stage was annotated by a uropathologist who roughly delineated the tumor tissue area (first column), including (A) AJCC TNM stage I, (B) stage II, (C) stage III and (D) stage IV. The attention scores of the predicted categories of patches are calculated by the model, and the attention heatmap corresponding to each WSI was generated and overlaid onto it (second column). It is then further zoomed in to show the heatmap of the ROI, highlighting the tumor and normal borders (third column). Patches with the highest attention (red border) often exhibit well-known tumor morphology, while patches of low interest (blue border) tend to be normal tissue or background (fourth column).

