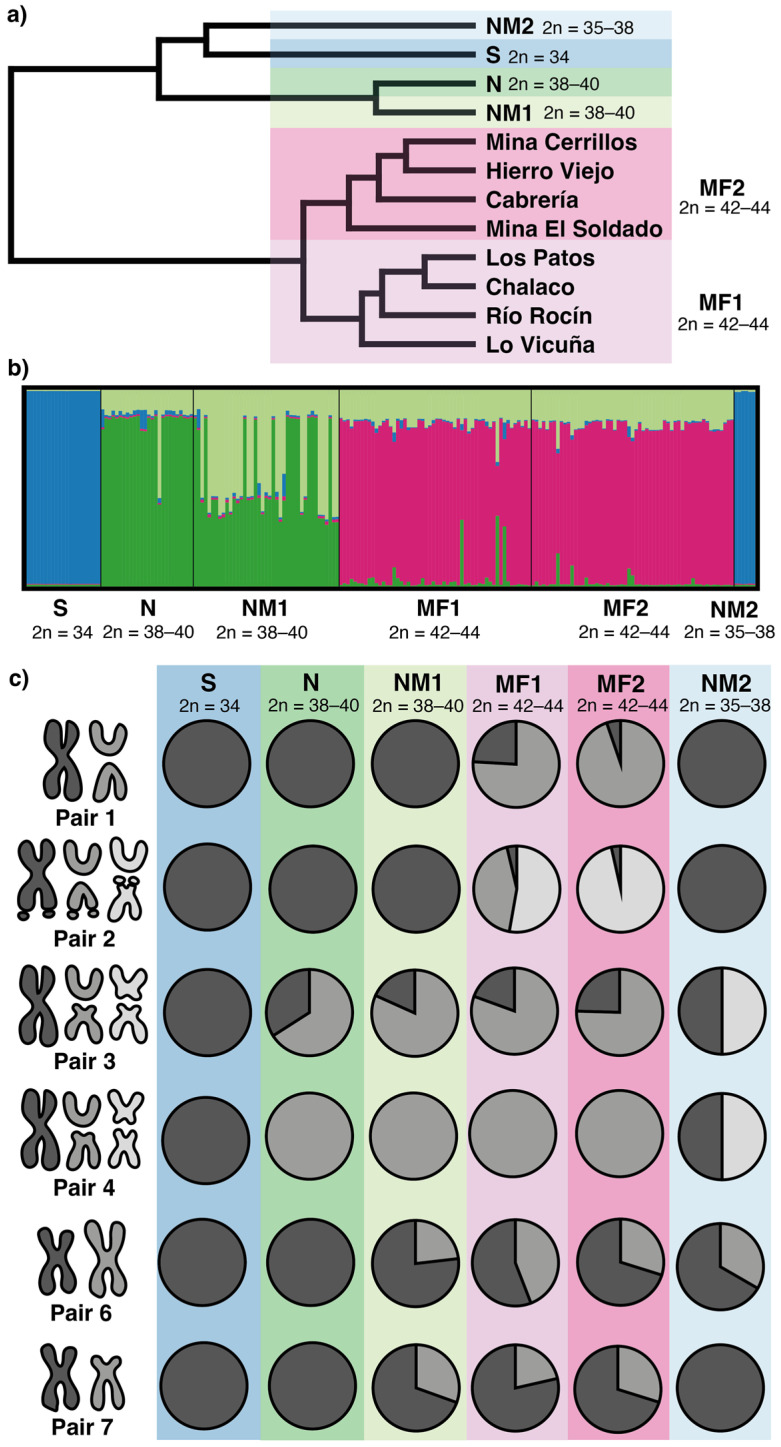
Figure 4.
Population cytogenetic analysis of L. monticola. (a) UPGMA dendrogram based on Rogers’ genetic distances between localities, showing the six chromosomal races organized geographically from left to right. (b) Structure plot based on chromosome alleles for K = 4. (c) Allele frequencies for each CR of the first seven chromosome pairs in all races.

