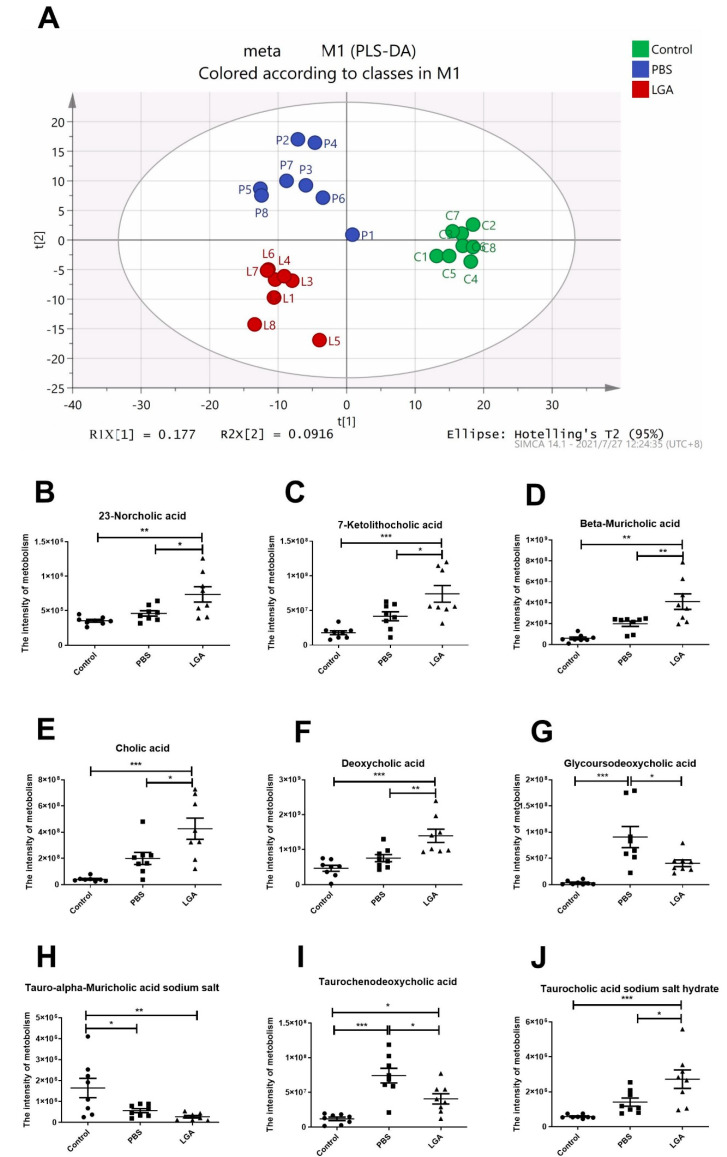
Figure 7.
The Effect of L. gasseri RW2014 on Serum Metabolism in Rat. (A) PLS-DA score plot of serum metabolite profile in three independent groups. (B–J) represent the intensities of 23−norcholic acid, 7−ketolithocholic acid, beta−muricholic acid, cholic acid, deoxycholic acid, glycoursodeoxycholic acid, tauro−alpha−muricholic acid sodium salt, taurochenodeoxycholic acid, and taurocholic acid sodium salt hydrate, respectively. The data were analyzed by an analysis of variance (ANOVA). * p < 0.05, ** p < 0.01, *** p < 0.001.

