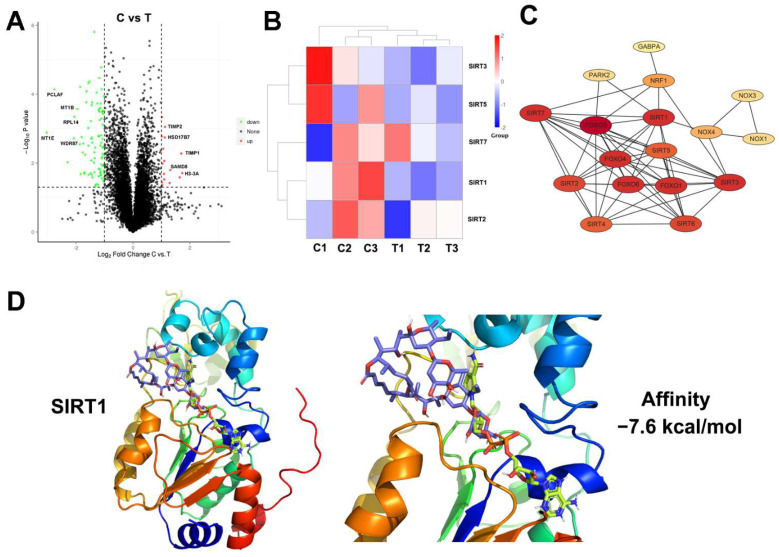
Figure 4.
Proteomic analysis and molecular docking for target prediction of elaiophylin in A549 cells. (A) Volcano plots of differentially expressed proteins. (B) Heatmap analysis of SIRTs between elaiophylin treated group (0.25 μM) and control group. C: controls, T: treatment. (C) PPI network for the SIRTs. (D) Computational docking of elaiophylin and SIRT1 protein. NAD+: yellow sticks; elaiophylin: purple sticks.

