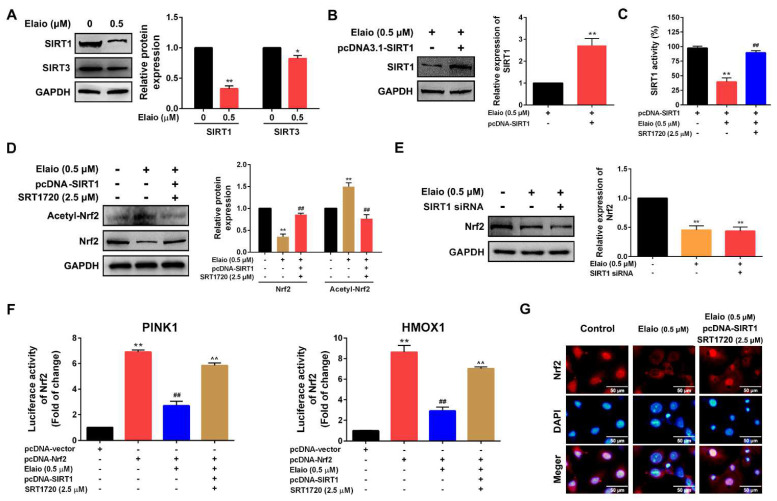
Figure 5.
Elaiophylin inhibits mitophagy by regulating SIRT1/Nrf2 signaling in A549 cells. (A) A549 cells were exposed to elaiophylin (0.5 μM) for 24 h and the expression of SIRT1 and SIRT3 were assessed by Western blot analysis. (B) SIRT1 was overexpressed in A549 cells. (C) A549 cells overexpressing SIRT1 were pre-treated with or without SRT1720 (2.5 μM) for 24 h and exposed to elaiophylin (0.5 μM) for 24 h. The activity of SIRT1 was assessed by SIRT1 activity assay. (D) A549 cells with SIRT1 overexpression were pre-treated with or without SRT1720 (2.5 μM) for 24 h and exposed to elaiophylin (0.5 μM) for 24 h. The expressions of Nrf2 and Acetyl-Nrf2 were assessed by Western blot analysis. (E) A549 cells with or without SIRT1 knockdown were exposed to elaiophylin (0.5 μM) for 24 h. The expression of Nrf2 was assessed by Western blot analysis. * p < 0.05, ** p < 0.01 vs. control, ## p < 0.01 vs. elaiophylin group. (F) The transcriptional activity of Nrf2 was assessed by dual-luciferase reporter assay. ** p < 0.01 vs. control, ## p < 0.01 vs. A549 cells with Nrf2 overexpression group. ^^ p < 0.01 vs. elaiophylin+pcDNA-Nrf2 group. (G) Localization of Nrf2 was assessed by immunofluorescence staining. Data were expressed as means ±SD of three experiments and each experiment included triplicated repeats. Original Western Blots can be found at supplementary materials.

