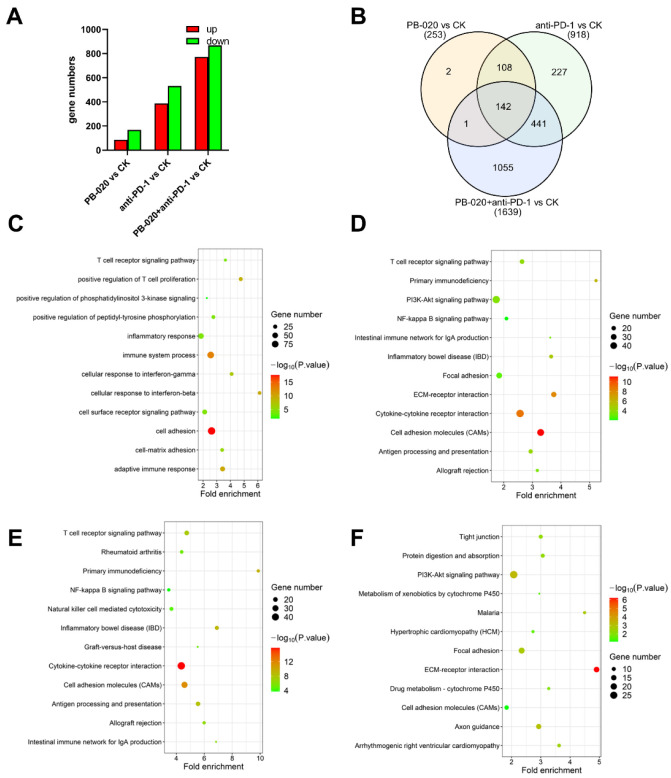
Figure 5.
Bioinformatics analysis of DE genes in PB-020/anti-PD-1 combination versus control group mentioned in Figure 4. (A) Triplicate tumor tissues from the 4 groups were collected and subjected to RNA-seq analysis, and the up-regulated and down-regulated gene numbers are shown. (B) The Venn diagram shows the number of differentially expressed (DE) genes between the PB-020, anti-PD-1 and PB-020/anti-PD-1 combination group versus the control group, respectively. (C) GO biological process analysis of the identified DE genes in the PB-020/anti-PD-1 combination versus control group. (D) Enrichment analysis of the KEGG pathway of the identified DE genes in the PB-020/anti-PD-1 combination versus control group. (E) Enrichment analysis of the KEGG pathway of the identified up-regulated genes in the PB-020/anti-PD-1 combination group versus control group. (F) Enrichment analysis of the KEGG pathway of the identified down-regulated genes in the PB-020/anti-PD-1 combination group versus control group. The size and color of the circles represent the number of enriched genes and the adjusted p value, respectively.

