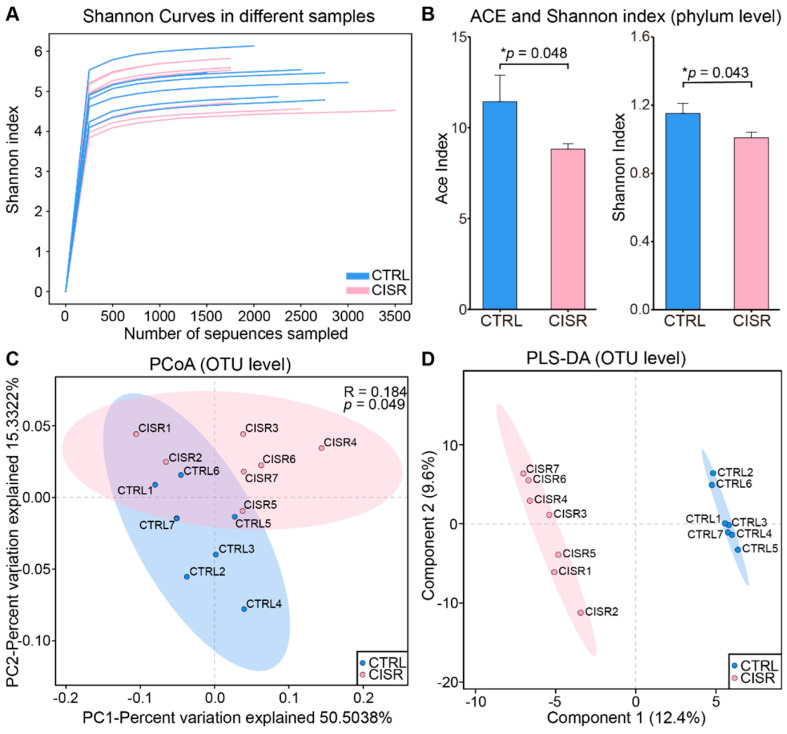
Figure 2.
α and β diversity analysis of gut microbiota showed differences between the CTRL and CISR groups. (A) The Shannon index curves of all samples. (B) Comparison of ACE (abundance-based coverage estimators) and Shannon index between CTRL and CISR groups at the phylum level. The values were presented as the mean ± SEM. Significant differences were indicated by asterisks (Wilcoxon rank-sum test, * p < 0.05). (C) A principal coordinate analysis (PCoA) based on a weighted UniFrac analysis of the CTRL and CISR samples. (D) A partial least squares discriminant analysis (PLS-DA) indicated that CTRL and CISR samples clustered in separate groups.

