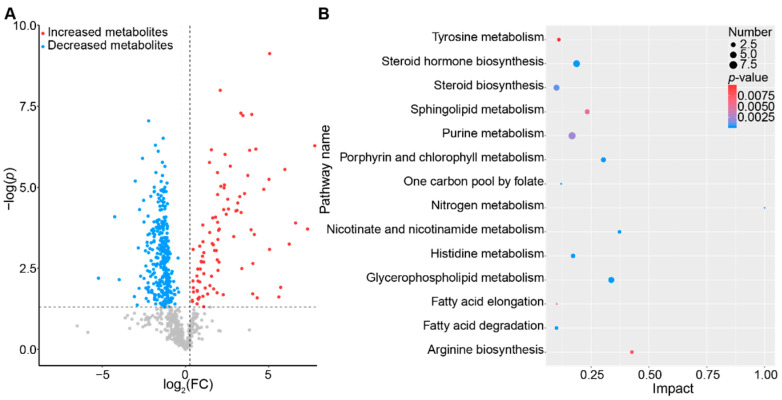
Figure 6.
Key metabolic pathways perturbed by CISR. (A) CISR perturbed the metabolic profiles of fecal samples in mice, with 405 metabolites significantly changed in comparison with the normal CTRL group (fold change > 1.2, p < 0.05). (B) Pathway enrichment analysis of differentially expressed metabolites.

