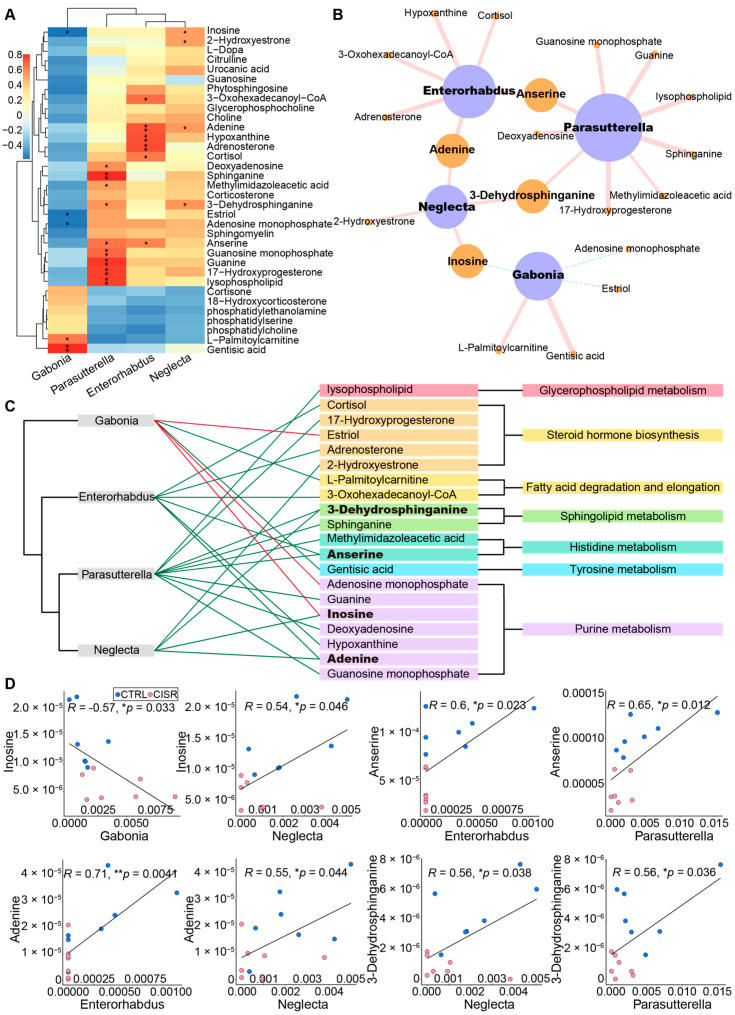
Figure 7.
CISR induced metabolic changes correlated with differences in the gut microbiome. (A) Correlation plot showed the functional correlation between perturbed gut bacteria and altered fecal metabolites at the genus level. (B,C) An integrated correlation-based network analysis (Pearson’s correlation) of microbes and metabolites. (B) The size of the nodes represented the number of significant correlations, and the thickness of lines represented the strength of correlations. The pink solid lines and a blue dotted lines represented positive and negative correlations, respectively. (C) The direction of the correlation was indicated by green (positive) or red (negative) lines, and bold indicates metabolites with greater correlativity. (D) Scatter plots illustrate associations between altered gut bacteria genera and typical gut microflora-related metabolites, including glycerophospholipids, fatty acids, amino acids, and purines (* p < 0.05; ** p < 0.01, Pearson’s test).

