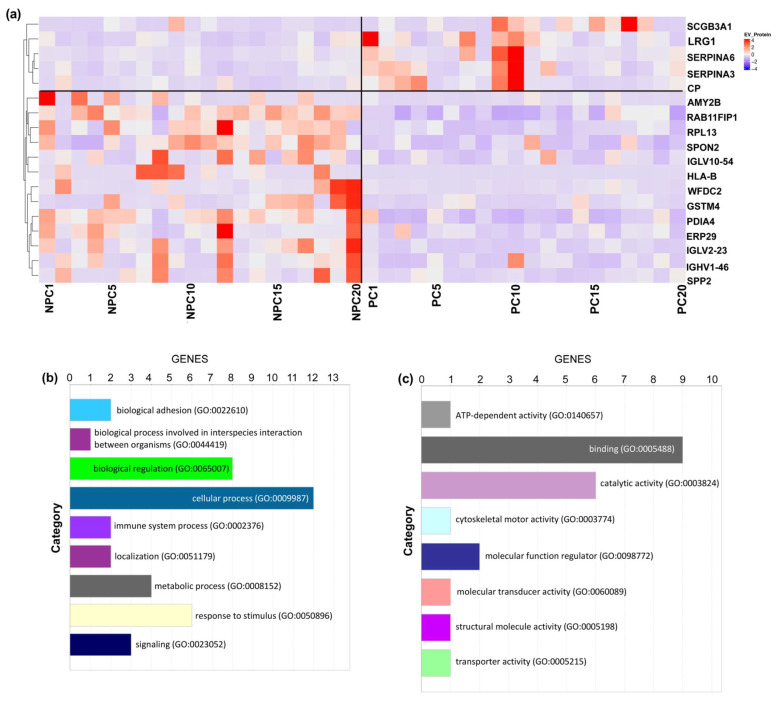
Figure 4.
Unsupervised Clustering and Biological Annotation for Differentiated EV Proteins. (a) Unsupervised clustering of all included participants using the 18 EV proteins with a significant difference. Each column indicates one participant, and each row indicates one EV protein. The colors indicate either upregulated (red) or downregulated (purple). (b) Biological process analysis. (c) Enriched pathway analysis.

