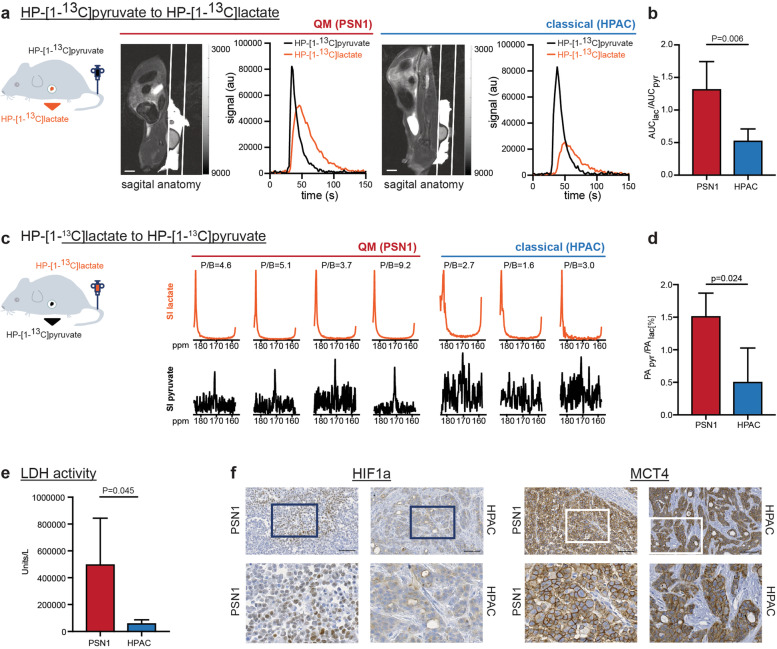
Fig. 5.
Magnetic resonance spectroscopy (MRS) of HP-[1-13C]pyruvate and HP-[1-13C]lactate interconversions in PSN1 (QM) and HPAC (classical) PDAC xenografts in rats. a Left to right: schematic presentation of HP-[1-13C]pyruvate i.v. injection into rats with xenografted PSN1 and HPAC tumors, T2-weighted sagittal anatomical image (scale bar = 1 cm) of a rat bearing a subcutaneous tumor, and graphs demonstrating signal intensity time courses of HP-[1-13C]pyruvate and HP-[1-13C]lactate measured intratumorally in PSN1 (left) and HPAC (right) rat xenografts. The HP-[1-13C]lactate curve (orange) is higher in PSN1 than HPAC xenografts. b Calculated relative AUC ratios of HP-[1-13C]lactate to perfused HP-[1-13C]pyruvate showing higher conversion rate in PSN1 (n = 4; 1.325 ± 0.418) than in HPAC tumors (n = 5; 0.5349 ± 0.175). c Left to right, schematic presentation of HP-[1-13C]lactate injected into rats with xenografted PSN1 and HPAC tumors and signal intensity (SI) spectra of perfused HP-[1-13C]lactate (top) and detected HP-[1-13C]pyruvate (bottom) for PSN1 (n = 4) and HPAC (n = 3) tumors. The spectra have been summed over 10 time points covering maximum tumor enhancement and normalized to the lactate signal. Higher peak-to-background ratios (P/B 3.7–9.2) were observed in PSN1 tumors in comparison with P/B ratios in HPAC tumors (P/B 1.6–3.0). d Signal intensity quantification: PApyr/PAlac ratios are significantly higher in PSN1 (1.49 ± 0.30, n = 4) than in HPAC tumors (0.51 ± 0.51, n = 3). PA, peak area. All P-values in this figure calculated by Student’s T-test (unpaired, two sided). e Ex vivo measurements of lactate dehydrogenase activity in imaged tumor sample. Higher activity in PSN1 (n = 5; 501,794 ± 341,920 U/L) than in HPAC tumors (n = 5; 62,796 ± 24,641 U/L) detected. f Representative immunohistochemistry for HIF1a and MCT4 in rat PSN1 (n = 4) and HPAC (n = 2) xenografted tumors. HIF1A-specific nuclear staining was detected exclusively in PSN1 (QM) tumor. MCT4 staining intensity only lightly stronger in PSN1 than in HPAC tumor. Scale bar, 100 µM

