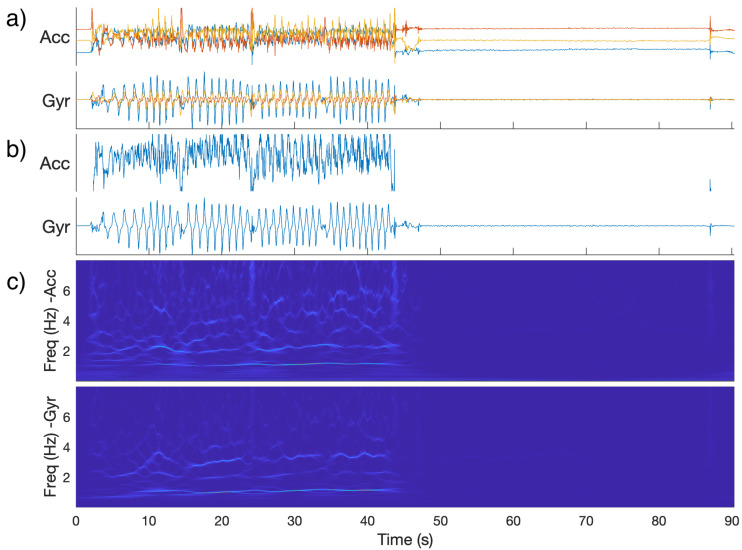
Figure 1.
(a): Raw IMU signals for a control subject performing the finger-nose-finger task with their right hand (one color per component). (b): Signals projected along first principal component. (c): Magnitude of synchrosqueezed transform (SST) of projected signals. Note: During the right half of the graphs, the measured hand was at rest. On the left-hand side, a noticeable feature is the group of horizontal lines around 1 Hz, which is the approximate frequency with which the subject completed the repeated motion.

