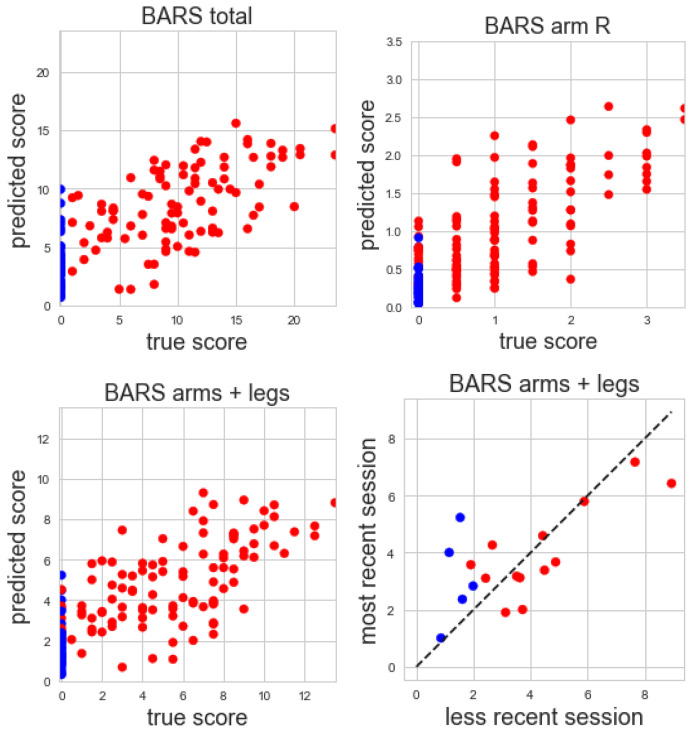
Figure 7.
From Top left: true vs. predicted total BARS scores; top right: true vs. predicted BARS right arm subscore; bottom left: true vs. predicted BARS arm and leg subscores; bottom right: test–retest reliability of BARS arm and leg subscores for subjects with multiple visits (red = ataxia, blue = control).

