Figure 2.
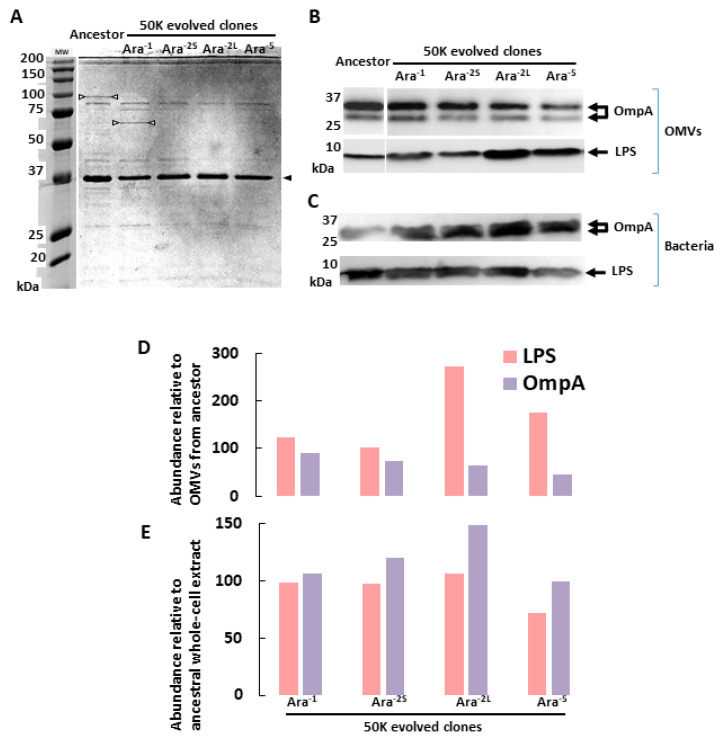
E. coli adaptation to the LTEE conditions leads to biochemical changes in OMV production. (A) Protein profiles of OMV preparations: equivalent amounts of OMVs (7.5 µg of total lipids) were separated on a 12% SDS-PAGE and revealed by Coomassie blue staining. The black arrowhead points to the major OmpA band migrating at the expected apparent molecular weight of 35 kDa. The white arrowheads point to unknown proteins that vary in abundance depending on the analyzed OMV preparation. (B) Equivalent quantities from each OMV preparation (corresponding to 7.5 µg of lipids) were separated on a 12% SDS-PAGE, transferred to nitrocellulose, and revealed by immunoblot using either polyclonal anti-OmpA or monoclonal anti-E. coli LPS antibodies. (C) Whole cell extracts of each bacterial clone (corresponding to 3 µg of proteins) were separated on a 12% SDS-PAGE, and immunoblotted using either polyclonal anti-OmpA or monoclonal anti-E. coli LPS antibodies. (D,E) The OmpA and LPS signals from immunoblots illustrated in B and C were quantified using Imagelab and presented as percentages relative to the ancestral strain signals for OMV preparations in D or for whole cell extracts in E.

