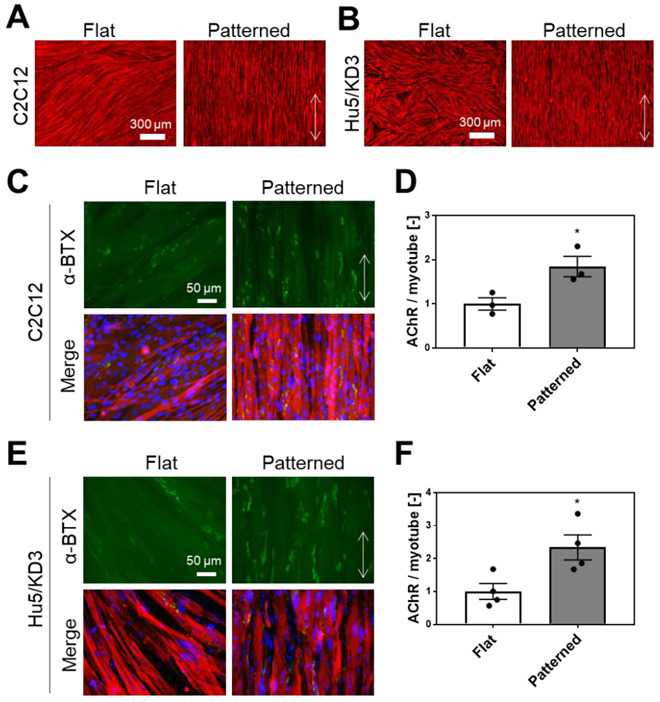
Figure 1.

Alignment and AChR clustering of SkM cells cultured on the surface with linear grooves. Immunofluorescence staining of (A) C2C12 and (B) Hu5/KD3 myotube cultured on the flat or patterned surface. Red indicates α-actinin. Scale bar: 300 µm. Fluorescence staining of AChR clustering in (C) C2C12 and (E) Hu5/KD3 myotube cultured on the flat or patterned surface. Green indicates AChR clustering, red indicates α-actinin, and blue indicates nuclei. Scale bar: 50 µm. Number of AChR clustering in (D) C2C12 or (F) Hu5/KD3 myotubes. Data points represent means ± SD (n = 3–4). Double arrow indicates the direction of linear grooves. * p < 0.05.
