
Figure 4.
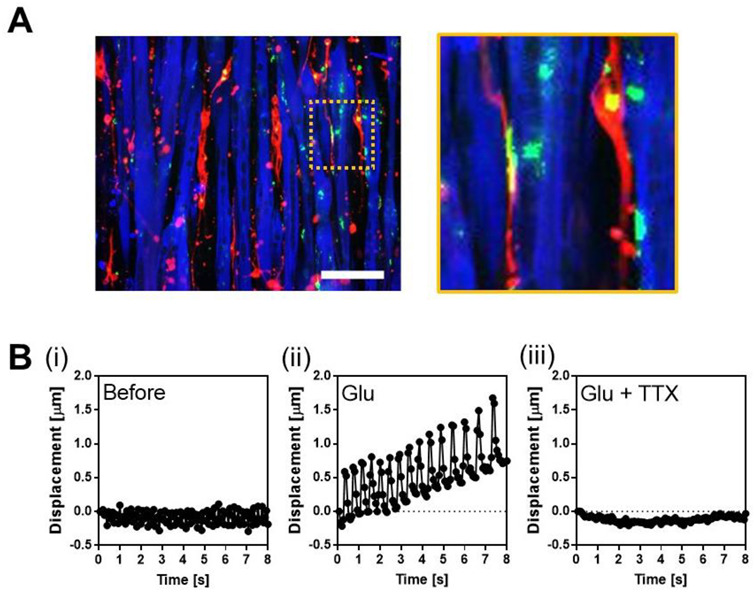
Co-culture of human SkM cells and MNs. (A) Immunofluorescent staining of co-culture on the linearly patterned surface. Green indicates AChR clustering, red indicates axon, and blue indicates MyHC. NMJs are surrounded by a dashed square, and a magnified view of this region is shown. Scale bar: 100 µm. (B) Representative contractile displacement of Hu5/KD3 myotubes co-cultured with iPSC-derived MNs on the patterned surface. (i) Before. (ii) After addition of glutamate (Glu). (iii) After addition of Glu and tetrodotoxin (TTX).