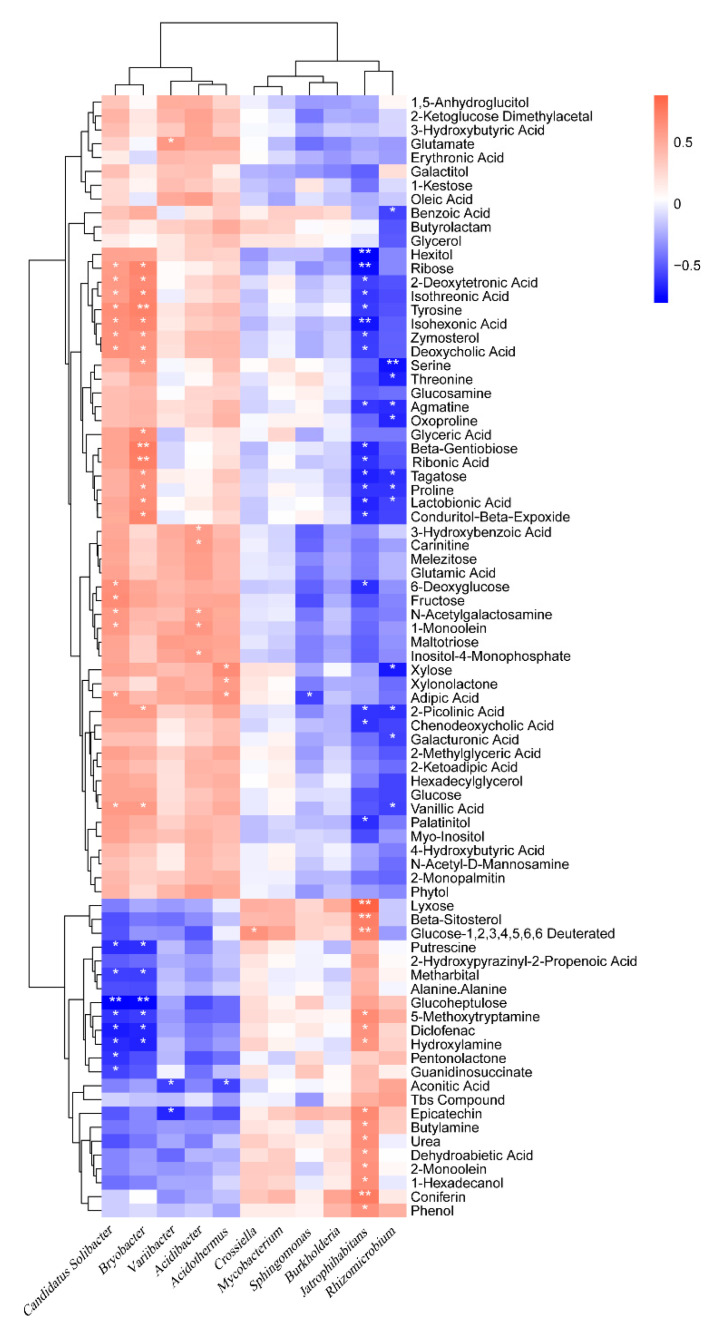
Figure 8.
Correlation analysis between the microorganism relative abundances at the bacterial genus level and the relative metabolite contents of the humic acid treatment. “*” and “**” represents a significant correlation at p < 0.05 and p < 0.01, respectively. The magnitude of the correlation coefficient was indicated by the depth of the orange and blue scale, while the orange darker color is the greater positive correlation, and the blue darker color is the greater negative correlation.

