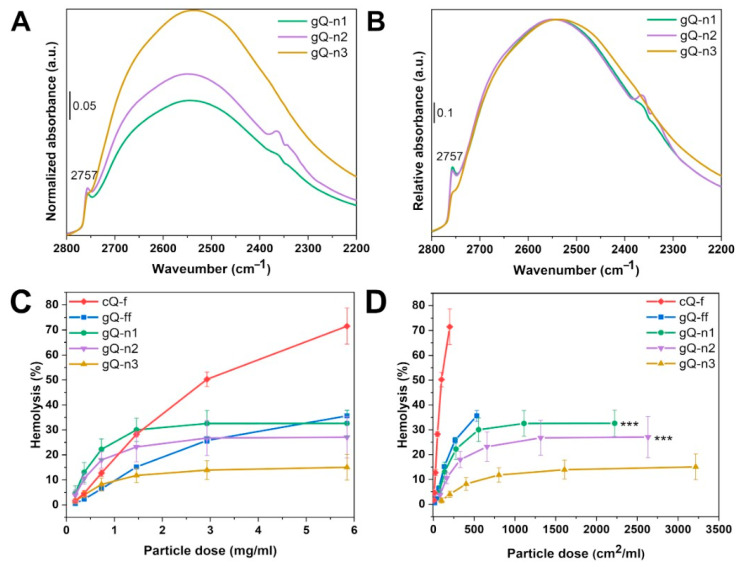
Figure 8.
Surface silanol distribution of nanoquartz samples (gQ-n1, gQ-n2, and gQ-n3). Transmittance FTIR spectra in the 2200–2800 cm−1 range (νSi-OD region) were collected at b.t. after H/D isotopic exchange and subsequent outgassing for 120 min. Spectra were normalized by the bulk mode and the SSA of the particles (A) or by the number of interacting silanols (B). Hemolytic activity of fine-fractured (gQ-ff) and nanoquartz samples (gQ-n1, gQ-n2, and gQ-n3), reported as function of the particle mass (C) or particle exposed surface area (D). A mined fractured quartz (cQ-f) was used as positive reference particle for the test. Data are mean ± s.d. of three independent experiments; p values of gQ-n1 and gQ-n2 compared to gQ-n3 determined by two-way ANOVA followed by Tukey’s post hoc test (mean effect): *** p < 0.001.

