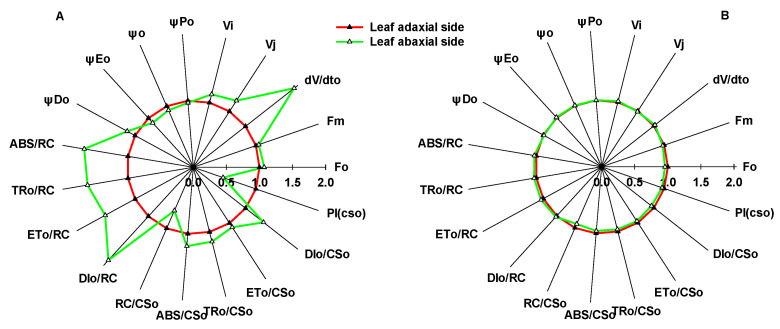
Figure 2.
Differences in the JIP-test parameters between the adaxial and abaxial sides of sunflower (A) and sorghum (B) leaves. Fo, minimal recorded fluorescence intensity; Fm, maximal recorded fluorescence intensity; VJ, relative variable fluorescence intensity at the J-step; VI, relative variable fluorescence intensity at the I-step; dV/dto, QA maximum reduction rate; φPo, maximum quantum yield for primary photochemistry (at t = 0); ψo, probability that a trapped exciton moves an electron into the electron transport chain beyond QA− (at t = 0); φEo, quantum yield for electron transport (at t = 0); φDo, quantum yield of energy dissipation (at t = 0); ABS/RC, absorption flux per reaction center (at t = 0); TRo/RC, trapped energy flux per reaction center (at t = 0); ETo/RC, electron transport flux per reaction center (at t = 0); DIo/RC, dissipated energy flux per reaction center (at t = 0); ABS/CSo, absorption flux per cross section (at t = 0); TRo/CSo, trapped energy flux per cross section (at t = 0); ETo/CSo, electron transport flux per cross section (at t = 0); DIo/CSo, dissipated energy flux per cross section (at t = 0); RC/CSo, density of QA-reducing PSII reaction centers; PICS, performance index on cross section basis (at t = 0).

