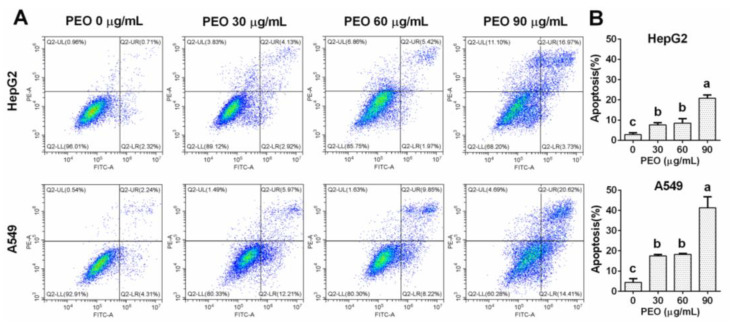
Figure 4.
Inducing apoptosis effect of PEO in HepG2 and A549 cells. HepG2 and A549 cells were treated with or without different concentrations of PEO (30, 60, and 90 μg/mL) for 24 h, then cells were collected and stained with annexin V-FITC/PI kit. (A) Apoptosis cells were determined on a Cytoflex S flow cytometer. (B) Percentages of apoptosis cells (early apoptotic cells and late apoptotic cells in the total cells) were presented. The values represent mean ± standard deviation of three independent experiments. Different letters indicate significant differences, p < 0.05.

