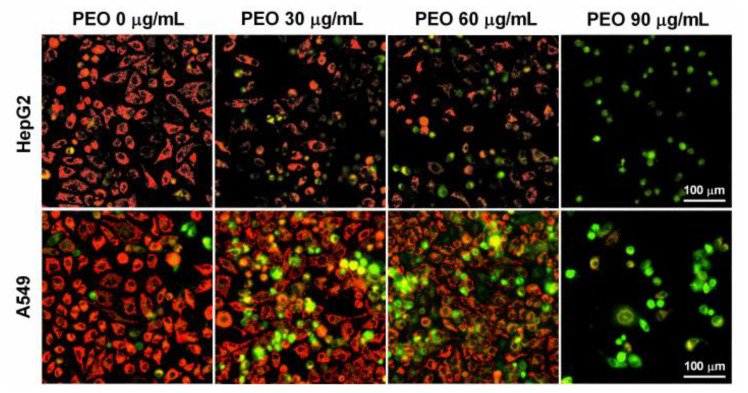
Figure 7.
Mitochondrial membrane potential staining of HepG2 and A549 cells treated by PEO. HepG2 and A549 cells were treated with or without different concentrations of PEO (30, 60, and 90 μg/mL) for 24 h, then stained with JC-1 for 20 min at 37 °C. After washing twice with PBS, the cells were photographed using ImageXpress Micro Confocal High-Content Imaging System.

