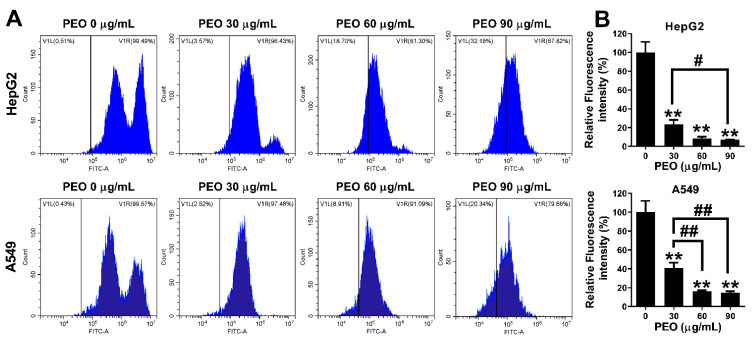
Figure 8.
ROS levels of HepG2 and A549 cells treated by PEO. HepG2 and A549 cells were treated with or without different concentrations of PEO (30, 60 and 90 μg/mL) for 24 h, then cells were collected and stained with DCFH-DA. (A) Fluorescence intensity was recorded on a Beckman Cytoflex S flow cytometer. (B) Relative fluorescence intensity was calculated; the values represent mean ± standard deviation of three independent experiments. # p < 0.05, ## p < 0.01, comparison between the two groups; ** p < 0.01 Compared with the control group.

