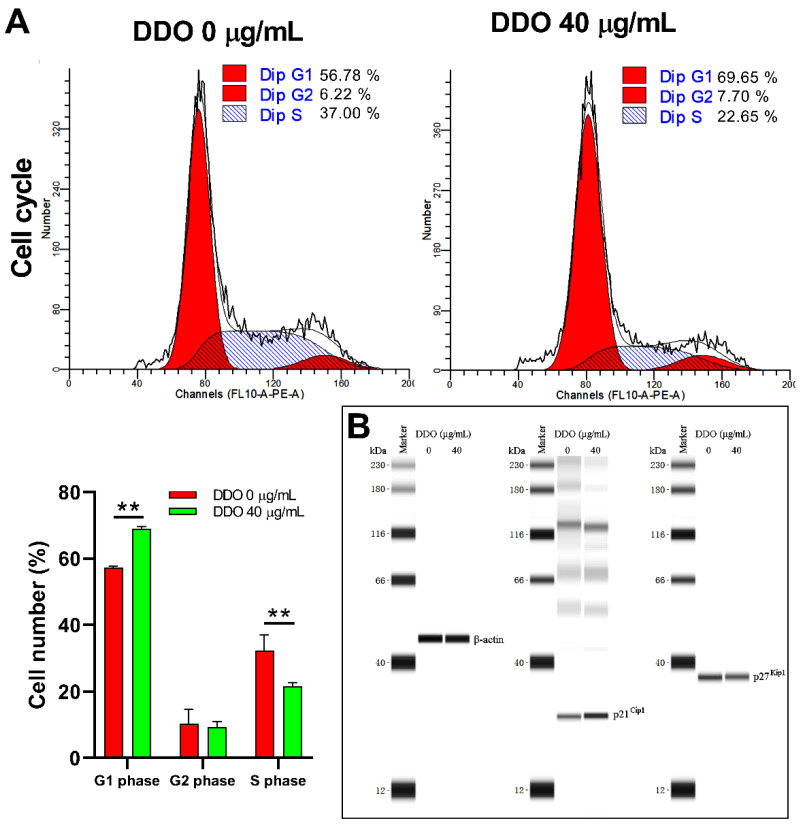
Figure 11.
Cell cycle analysis of A549 cells treated with DDO. (A) A549 cells were treated with DDO (40 µg/mL) for 24 h; cells were fixed and stained with PI/RNase Staining Buffer for 30 min. The cell cycle distributions were analyzed on a Cytoflex S flow cytometer. (B) Expression levels of p21Cip1 and p27Kip1 in A549 cells treated with DDO (40 µg/mL) were detected on a Simple Wes System. The values represent mean ± standard deviation of three independent experiments. ** p < 0.01.

