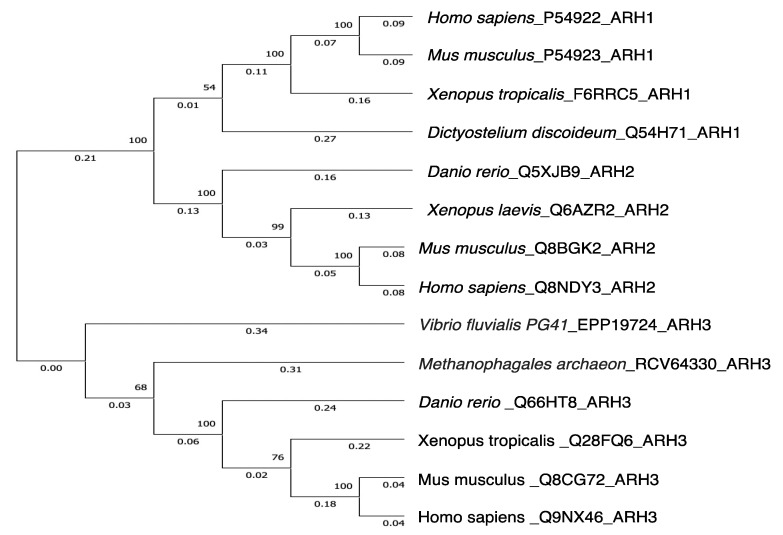
Figure 3.
Phylogenetic trees showing genetic relationships of ARH1, ARH2 and ARH3.The tree was constructed by the UPGMA in the Evolutionary Genetics Analysis X (MEGAX) program (https://www.megasoftware.net/, accessed on 13 October 2022). The evolutionary distance was computed using p-distance method by the MEGAX [106,107]. Reference sequences are indicated by species_accession number_protein name. The bootstrap values (%) of 500 replications are shown at each internal node. Genetic variations between human ARH1 and human ARH2 or human ARH3 were 0.57 and 0.82, respectively. Amino acid sequences were obtained from UniProt (https://www.uniprot.org/, accessed on 13 October 2022).

