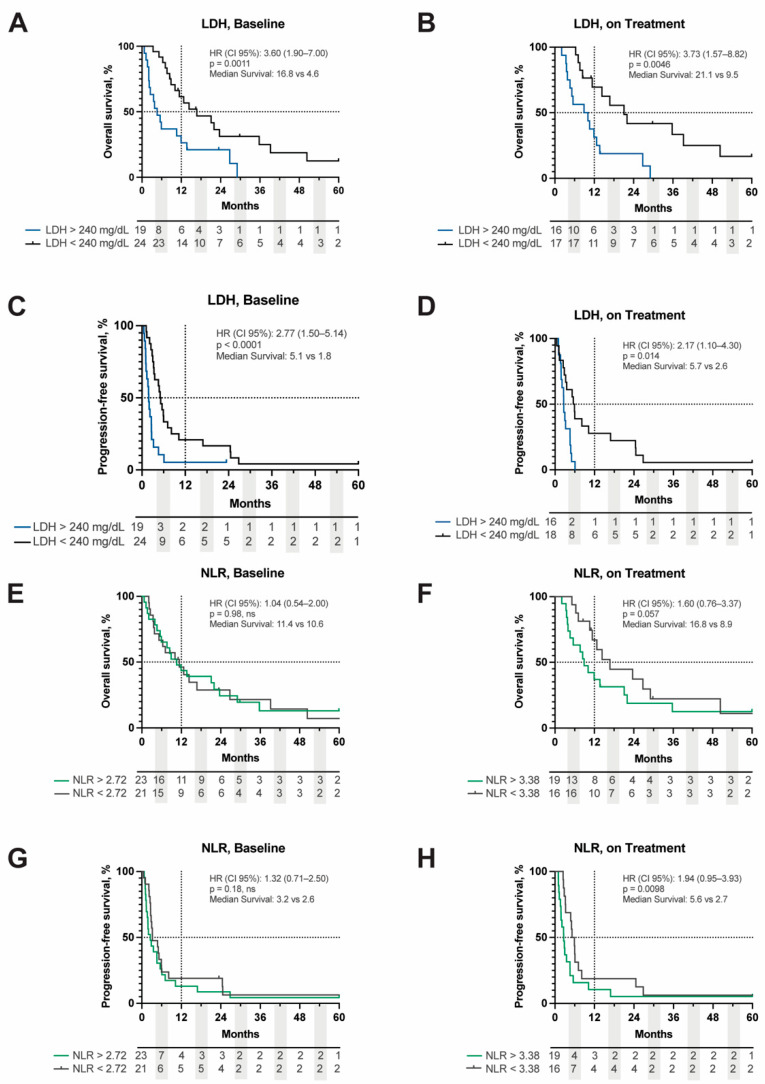
Figure 2.
Kaplan–Meier curve of OS and PFS stratified by LDH value above or below 240 mg/dL at baseline (A,C) and on treatment (B,D). OS and PFS of NLR stratified by the median cut point of 2.72 at baseline (E,G) and 3.38 on treatment (F,H). Dashed lines represent 50%- and 12-month survival points, respectively. Hazard ratios (HR), p-values, and median survival are displayed in the upper right corner of each respective graph. Baseline = ICB start; on treatment = response assessment 8 weeks following ICB initiation. LDH = lactate dehydrogenase, NLR = neutrophil:lymphocyte ratio, OS = overall survival, PFS = progression-free survival.

