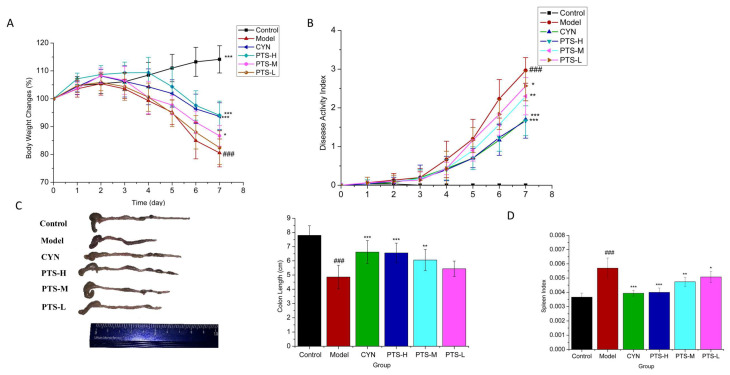
Figure 2.
Effects of PTS on clinical symptoms of mice with DSS-induced ulcerative colitis: (A) body weight change of each group (n = 10); (B) disease activity index (DAI) (n = 10); (C) colon length (n = 10); (D) spleen index (n = 10). Data are expressed as the means ± SDs. ### p < 0.001 vs. control. * p < 0.05, ** p < 0.01, and *** p < 0.001 vs. model group.

