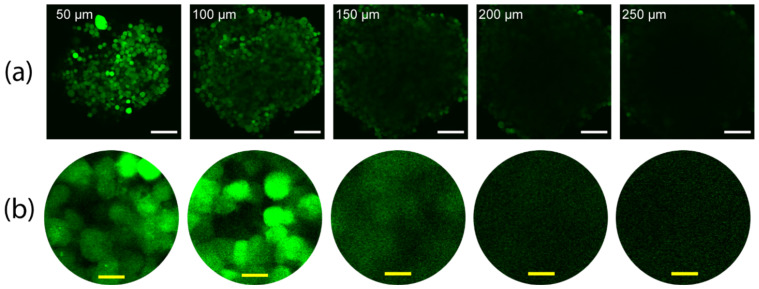
Figure 1.
The gradual dimming and blurring in images of a z-stack with depth, taken using two-photon microscopy (a) z-stack images of a spheroid made with EGFP-positive NCI-H1299 lung cancer cells. Labels show the depth of each image in the spheroid. (b) 5× zoomed images of the center of the images in row a and histogram-adjusted for better visibility in the higher depths. White and yellow scale bars denote 100 µm and 10 µm, respectively.

