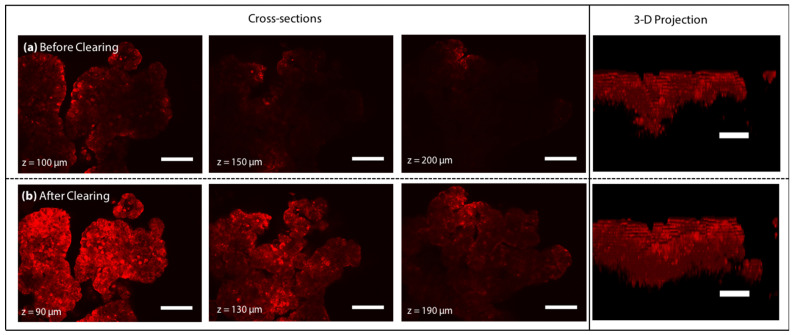
Figure 2.
Two-photon microscopy image slices of a tumour spheroid at 100, 150 and 200 µm deep into the tissue (a) before clearing with the corresponding z-stacks and (b) after clearing with HyClear-Pre1 solution (changed due to shrinkage). The 3-D projection image of the spheroids is shown on the right. The scale bars represent 100 µm.

