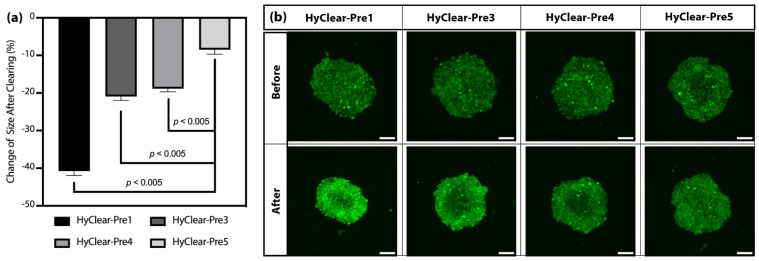
Figure 5.
(a) The average change of the cross-sectional area of the cross-sectional images before and after clearing using HyClear with different concentrations of urea. (b) An example of the MIP image of the spheroids before and after tissue clearing using different concentrations of urea. The error bars represent the standard error of the mean of five to six replicates. The p-values are calculated using a heteroscedastic two-tailed t-test. The scale bars represent 200 µm.

