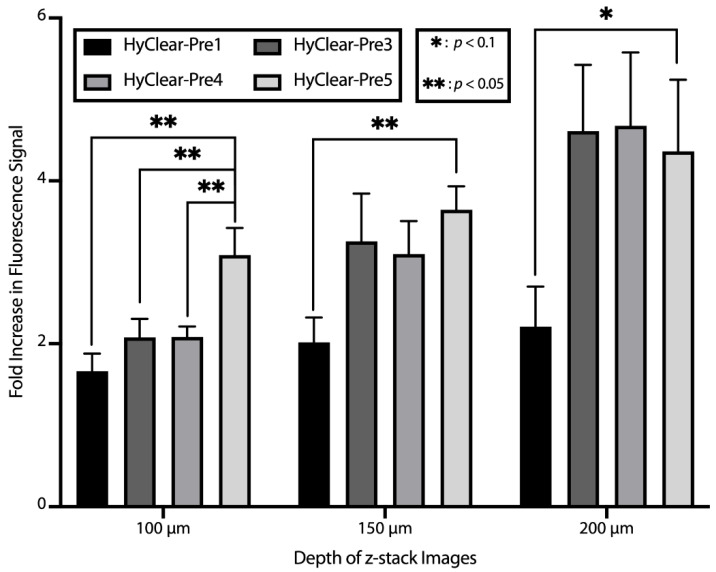
Figure 6.
The average fold increase in the fluorescence signal after clearing in different imaging depths using different clearing methods versus HyClear. The p-values are calculated using a heteroscedastic two-tailed t-test. The error bars represent the standard error of the mean of five–six replicates.

