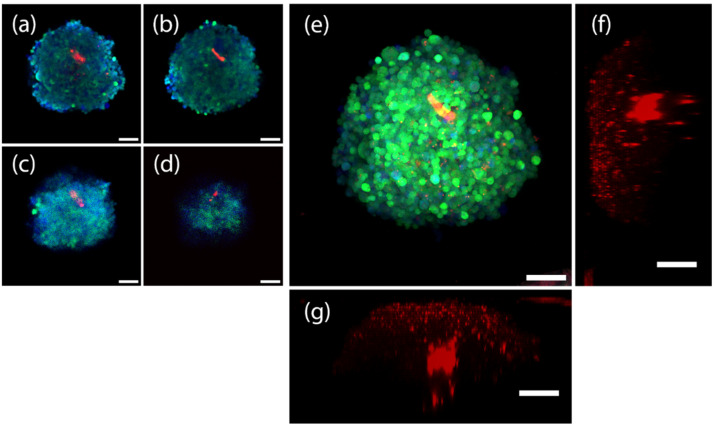
Figure 10.
10× confocal images (after clearing with HyClear, histogram-adjusted) of a triculture spheroid of epithelial, fibroblast and endothelial cells, depicted by dGFP (green), CellTracker Blue (blue) and mCherry (red) colours, respectively. (a–d) are histogram adjusted z-slices of the spheroid at (a) 150 µm, (b) 200 µm, (c) 250 µm, and (d) 300 µm. (e) depicts the maximum projection image of the spheroid. (f,g) depict the 3D projection of the spheroid (red channel only) from the Y and X axes, respectively. Scale bars represent 100 µm.

