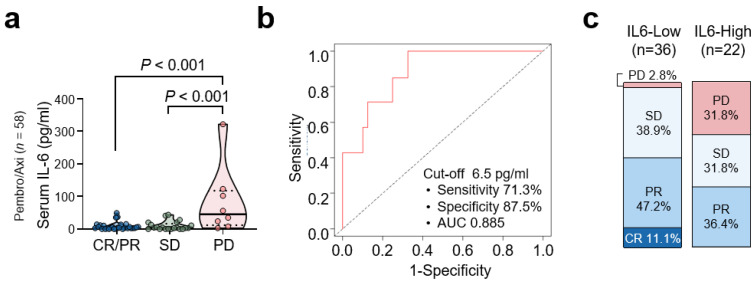
Figure 2.
Baseline serum IL-6 levels and survival outcome with pembrolizumab/axitinib therapy. (a) Comparison of IL-6 levels according to the best response. Values were compared using ANOVA with Tukey’s post hoc test with respective p-values given in each plot. (b) Time-dependent receiver operator characteristic curve of serum IL-6 levels. (c) Bar charts showing the best response to therapy by IL-6 level.

