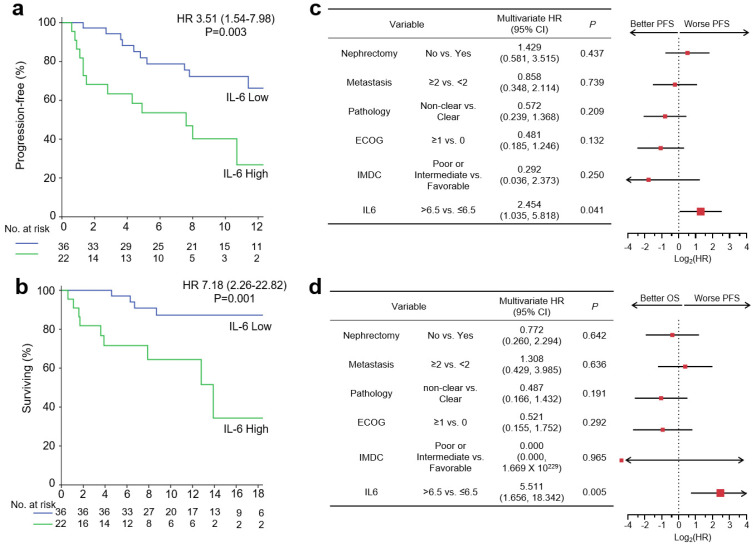
Figure 3.
Baseline serum IL-6 levels and survival outcome with pembrolizumab/axitinib therapy. IL-6 > 6.5 pg/mL was defined as IL-6 High. (a) Kaplan–Meier curves showing PFS according to IL-6 level. (b) Kaplan–Meier curves showing OS according to IL-6 level. (c) Forest plots showing PFS according to nephrectomy, metastasis, pathology, Eastern Cooperative Oncology Group (ECOG) performance status, International Metastatic Renal Cell Carcinoma Data Consortium (IMDC) risk criteria, and IL-6 status. (d) Forest plots showing OS according to nephrectomy, metastasis, pathology, ECOG performance status, IMDC risk criteria, and IL-6 status. Hazard ratios and 95% confidence intervals are shown in survival curves and forest plots. Multivariate analyses were conducted using Cox proportional hazard regression. PFS, progression-free survival; OS, overall survival.

