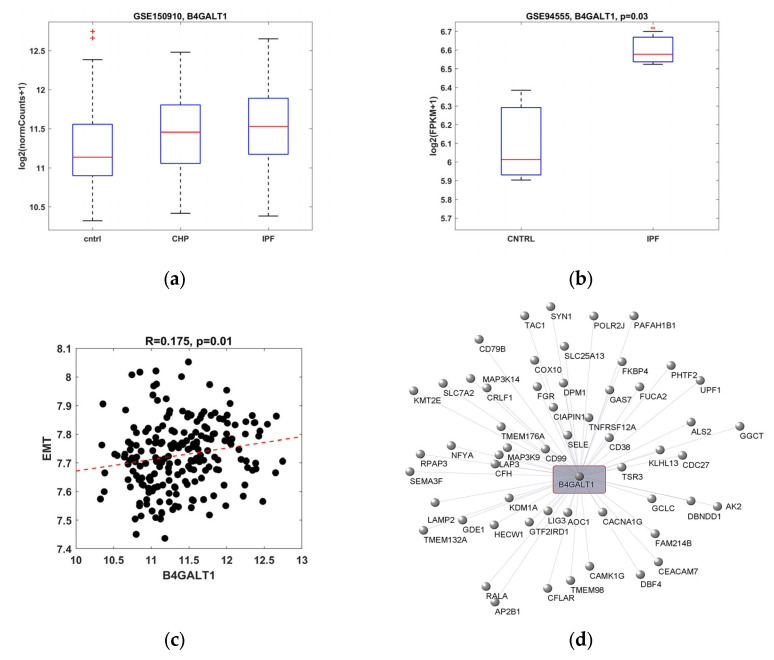
Figure 1.
Bioinformatic analysis to evaluate B4GALT1 in silico expression. (a) Box plot representing B4GALT1 expression from RNA-seq-based transcriptomic analysis for whole lung tissues from 82 chronic hypersensitivity pneumonitis (CHP), 103 IPF, and 103 control subjects. We observed a statistical significance comparing both CHP and IPF samples to healthy subjects (p = 7 × 10⁻³, p = 4.1 × 10⁻⁵, respectively) by using the Wilcoxon rank sum test. No difference was revealed between CHP and IPF samples (p = 0.15). A Kruskal–Wallis test among three groups was also evaluated (p = 1.2 × 10⁻⁴). Data from the GEO database with access ID GSE150910. (b) Box plot representing B4GALT1 expression from scRNA-seq transcriptomic analysis of normal and IPF respiratory epithelial cells obtained from peripheral lung of controls (n = 3) and IPF patients (n = 3), respectively. Statistical significance was assessed by Student’s t-test. Data from GEO database with access ID GSE94555. (c) Scatter plot of Pearson’s correlation between B4GALT1 expression and the mean expression of HALLMARK_EPITHELIAL_MESENCHYMAL_ TRANSITION genes. Data from GEO database with access ID GSE150910. (d) Graphical network analysis obtained by Pearson’s correlation between B4GALT1 and 55 positive correlated genes involved in the EMT pathway.

